Submit an Article
Navigate
Home
Editorial Board
Editorial Policies
Current Volume
Archive
Scientific Integrity
Publication Ethics Statements
Interviews with Outstanding Authors
Newsroom
Sponsored Conferences
Podcast
Contact
Special Collections
Submit an Article
Online ISSN: 1945-4589
Research Paper
|
Volume 15, Issue 12
|
pp. 5751–5774
Construction of a T-cell exhaustion-related gene signature for predicting prognosis and immune response in hepatocellular carcinoma
Back to article
Figure 8
(8 of 10)
−
100%
+
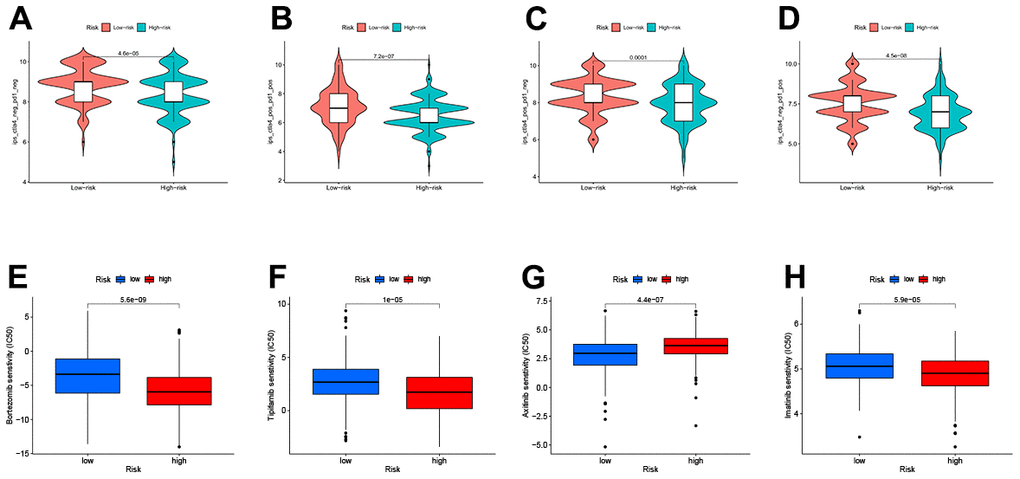
Figure 8.
Relationship between TEXPM and (IPS) analysis and drug sensitivity (
A
–
D
) low-TEXPM and high-TEXPM response to IPS. (
E
–
H
) Treatment of different small molecule drugs by high and low-TEXPM groups.