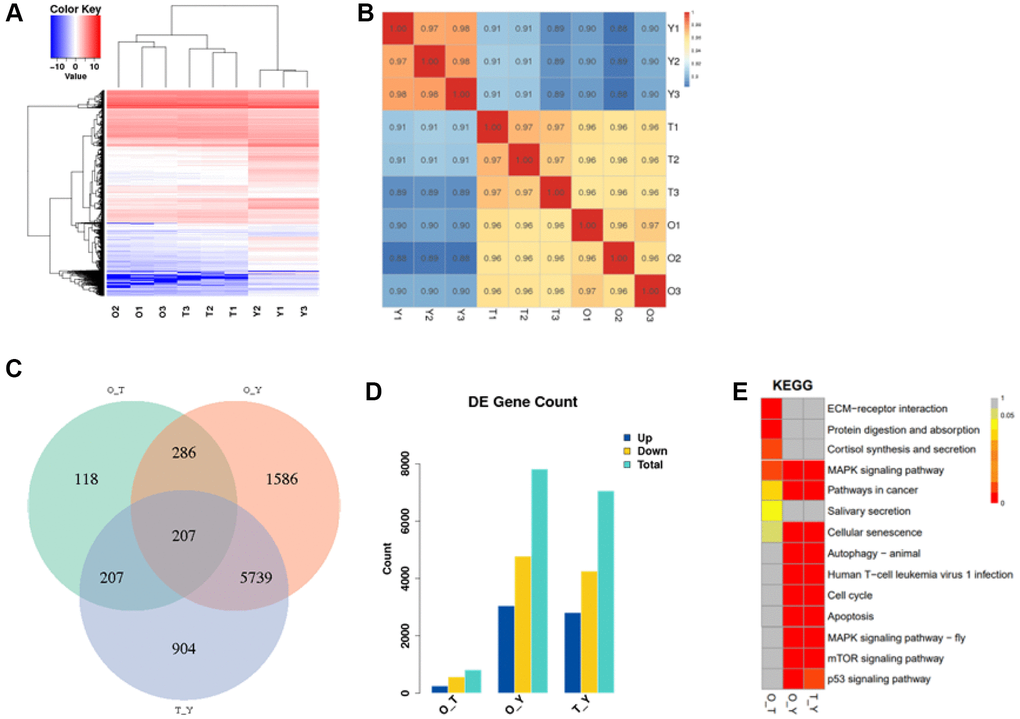
Figure 4.The transcriptional landscape of porcine follicles. (A) Heat map and hierarchical clustering of differentially expressed genes. Red color indicates high gene expression and blue color indicates low gene expression. (B) Correlation heatmap of transcriptomic similarity among 6 aging follicles samples and 3 young control follicles tissues. Inter-sample gene expression correlation is indicated by the color bar above the heatmap. (C) Venn diagram showing the intersection of DEGs among two normal control follicles vs. Treatment. DEGs were identified by the R package DESeq2 under the cutoff of adjusted P < 0.05. (D) Statistical graph of differentially expressed genes. (E) Distribution of differential gene enrichment pathways in each comparison group. Different colors represent different degrees of enrichment, the redder the color the more significant the enrichment. (Abbreviations: O: Old; T: Treatment; Y: Young).