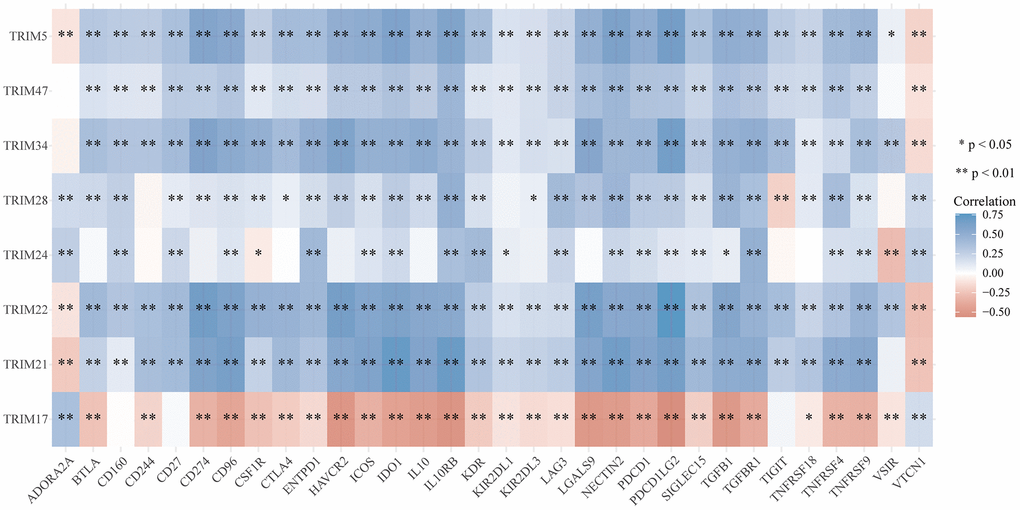
Figure 12.Correlation analyses of the expression profiles of TRIM family with immune checkpoint molecules in gliomas. The horizontal and vertical ordinates represent genes, and different colors represent correlation coefficients (in the diagram, blue represents positive correlation, red represents negative correlation), and the darker the color represents the two stronger correlations. *p < 0.05; **p < 0.01; ***p < 0.001.