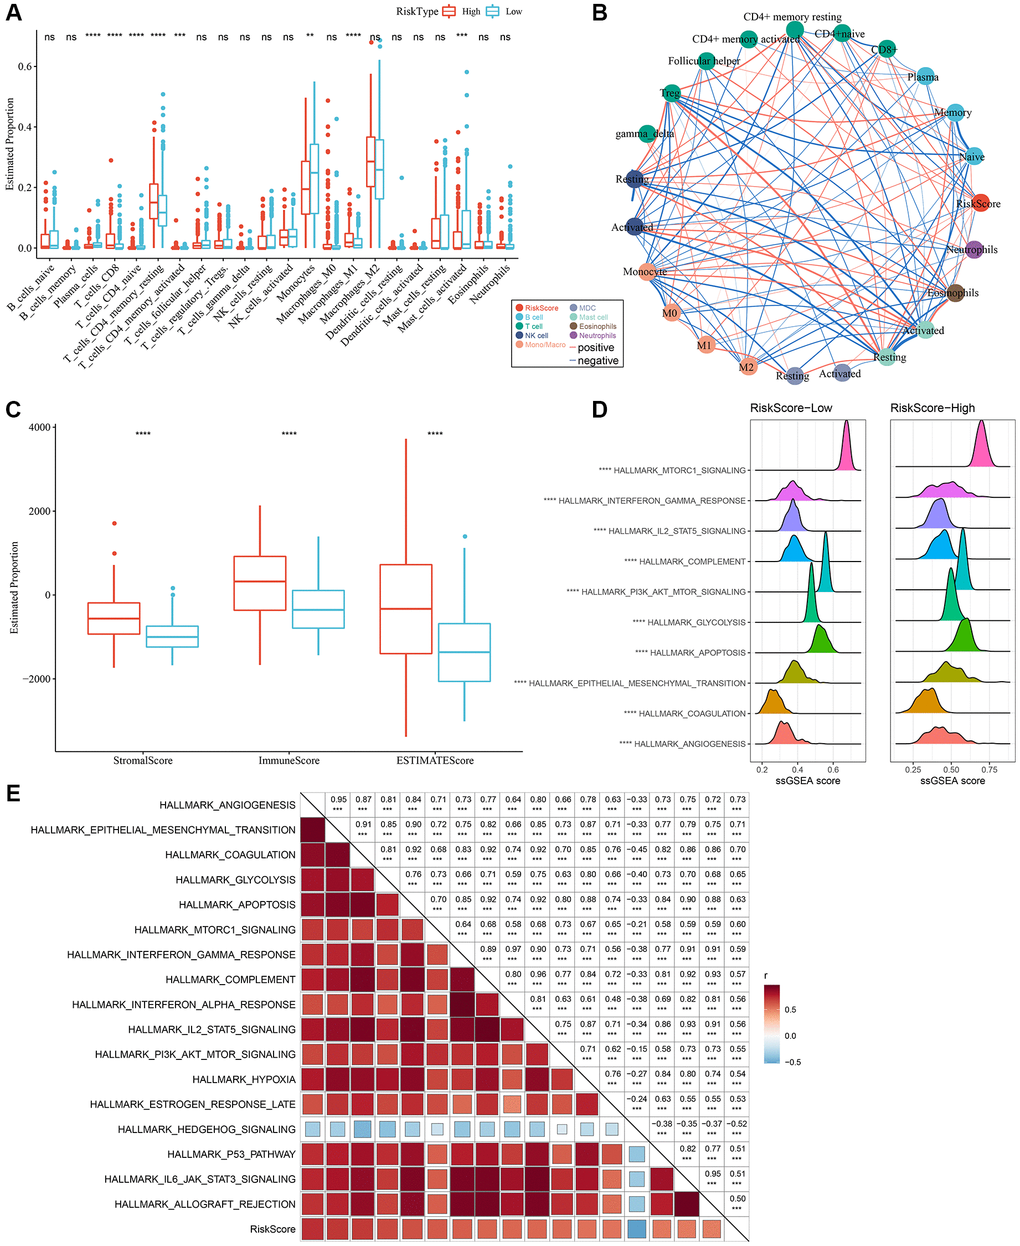
Figure 7.Different infiltration levels of various immune cells between the two RiskScore groups. (A) The amount of immune cell components in the TCGA cohort. (B) Correlation analysis of RiskScore with 22 immune cell components in the TCGA cohort. (C) The proportion of immune cell components in the TCGA cohort calculated by ESTIMATE software. The red box indicates high-risk group, and blue box indicates low-risk group. (D) Top 10 pathways with the most significant differences between low-RiskScore and high-RiskScore groups. (E) Correlation between KEGG pathways with correlation coefficient >0.5 and RiskScore. **P < 0.01; ***P < 0.001; ****P < 0.0001. Abbreviations: ns: no significance; NK: natural killer; MDC: myeloid dendritic cell; ssGSEA: single-sample GSEA; GSEA: gene set enrichment analysis; TCGA: The Cancer Genome Atlas; KEGG: Kyoto Encyclopedia of Genes and Genome.