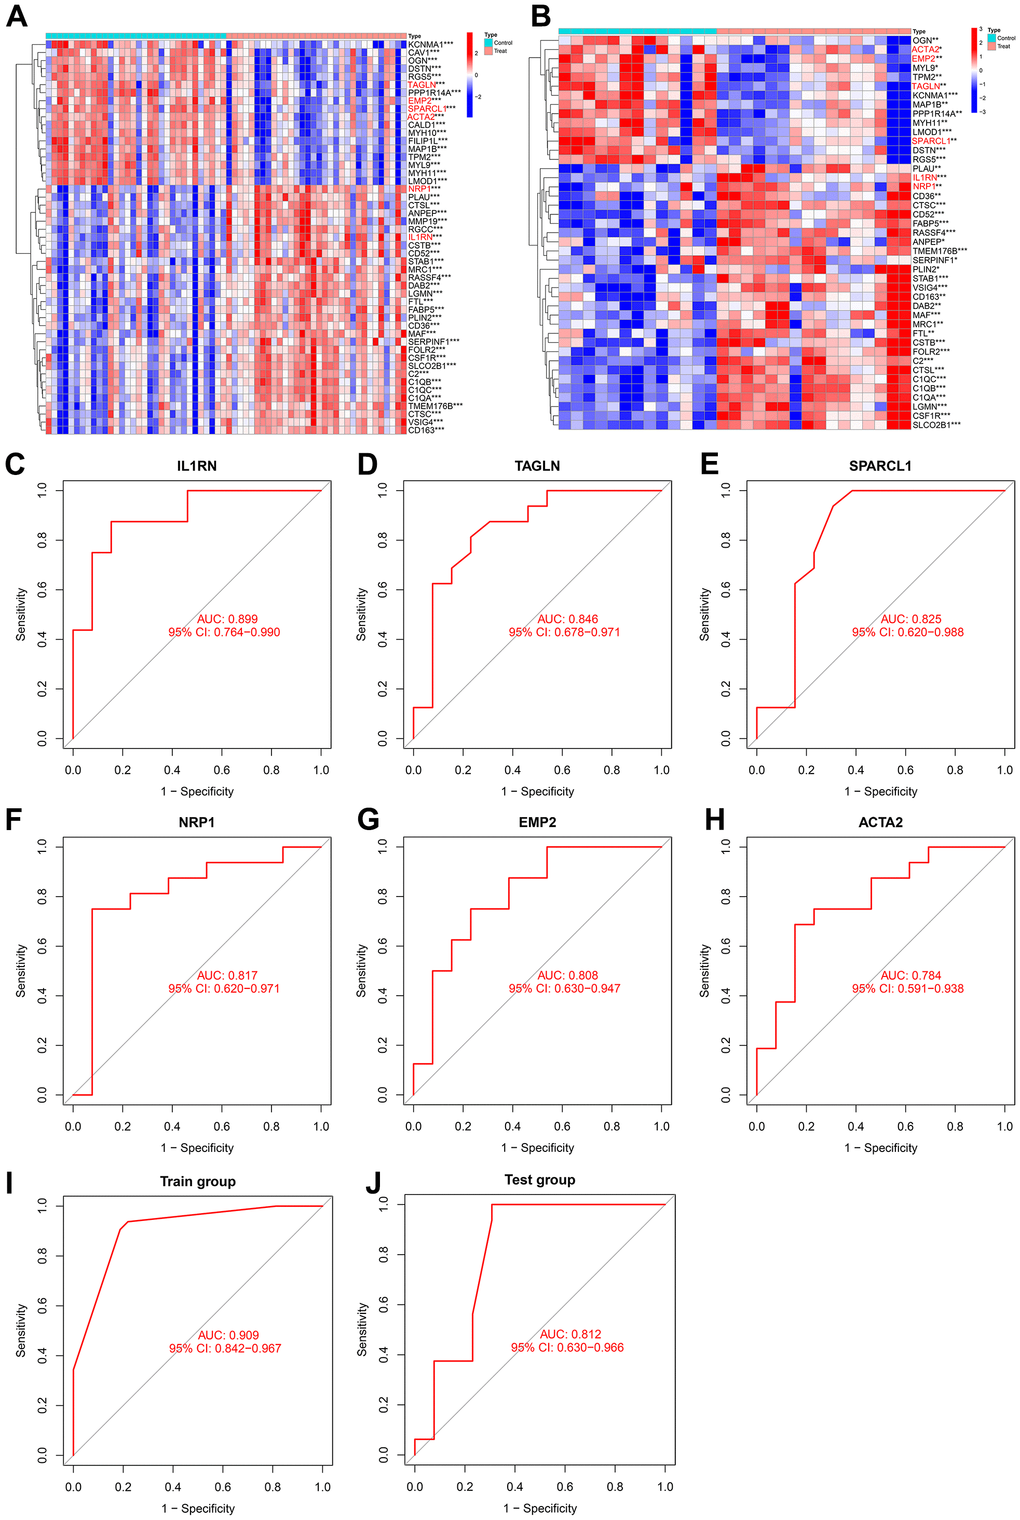
Figure 8.(A) Heatmap of intersecting genes in the training group. (B) Heatmap of intersecting genes in the test group. (C–H) ROC curves of disease signature genes in the test group. (I, J) The area under the curve of the AS prediction model in the train group and test group.