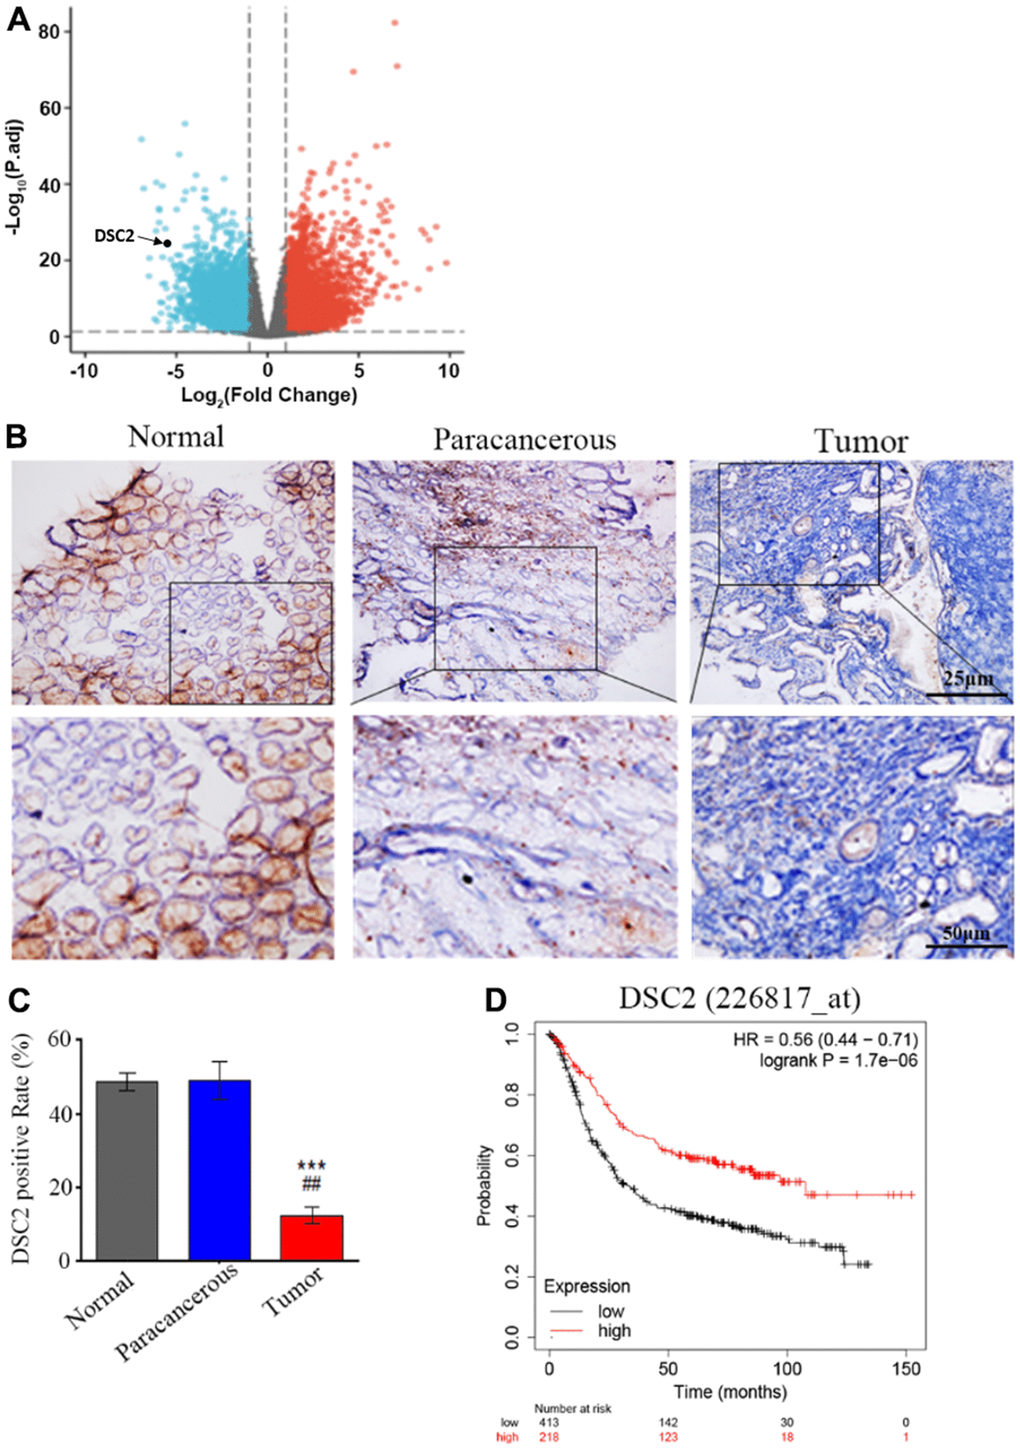
Figure 1.DSC2 is downregulated in GC tumors and its expression is prognostic for worse overall survival. (A) Volcano plot displayed the pattern of upregulated and downregulated genes in normal and tumor specimens of GC patients from TCGA data, the red dots in the right plot represented upregulated genes, blue dots denoted downregulated genes with statistical significance, and gray dots exhibited no differentially expressed genes. (B, C) The expressions of DSC2 in adjacent normal tissues (N), paracancerous tissues (P), and GC tissues (T) of clinical specimens were tested through IHC, blue is the nucleus and brownish yellow is the DSC2 expression, the scale bar = 25 μm, ***p<0.001 vs. N, ##p<0.01 vs. P. (D) The Kaplan-Meier curves (overall survival) of GC patients with different expression of DSC2, the data was obtained from the website: https://kmplot.com/analysis/index.php?p=service.