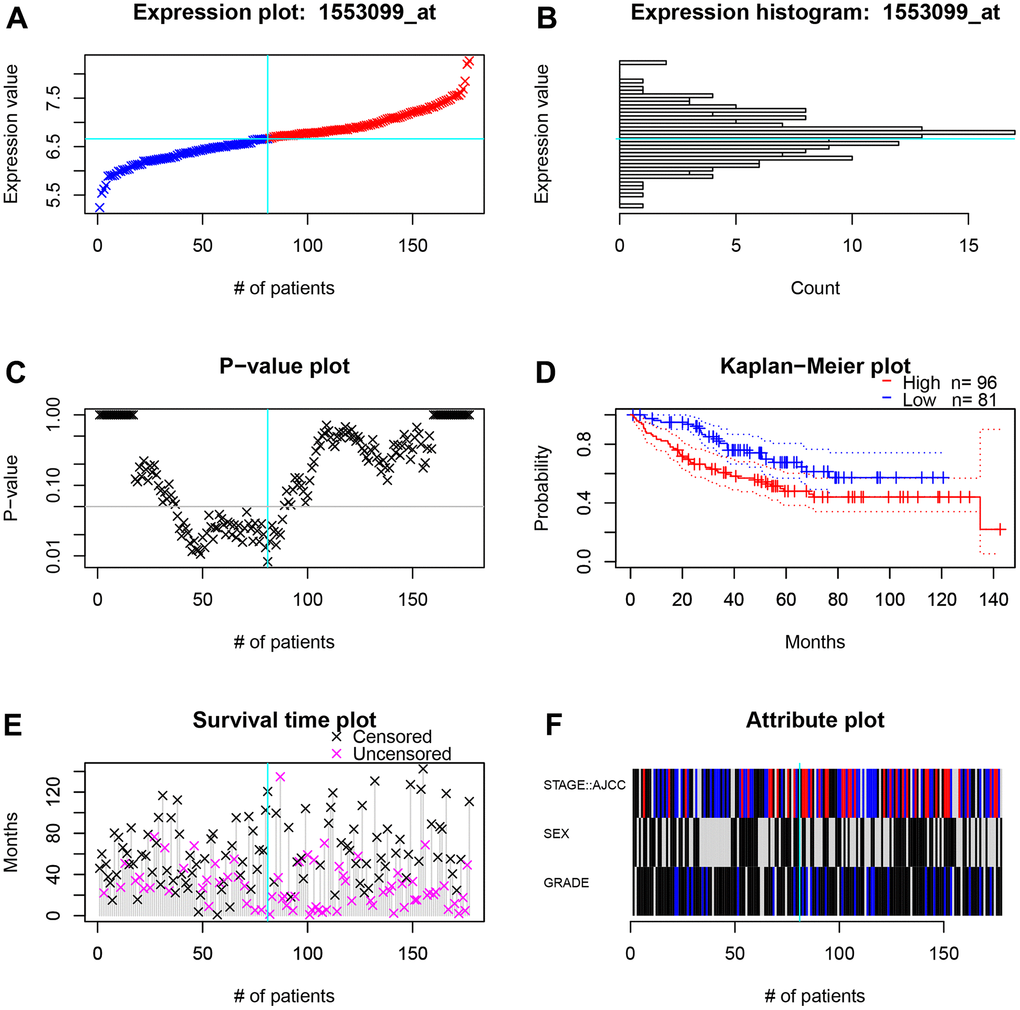
Figure 9.The survival and clinicopathological classifications of TIGD1 in GSE17536 cohort. (A) Expression plot. CC patients are ordered by the TIGD1 expression. Cyan lines show the optimal cutpoints that dichotomize patients into high (red) and low (blue) expression groups. (B) TIGD1 expression histogram. The line of the optimal cutpoint is also shown (cyan). (C) P-value plot of TIGD1. For each potential cutpoint of expression measurement, patients are dichotomized and survival difference between high and low expression groups is calculated by log-rank test. The cutpoint to minimize the P-value is determined and indicated by the cyan line. (D) Kaplan-Meier plot of TIGD1. Survival curves for high (red) and low (blue) expression groups dichotomized at the optimal cutpoint are plotted. 95% confidence intervals for each group are also indicated by dotted lines. (E) Survival scatter plot of TIGD1. A dot represent a CC patient (pink represents uncensored, black represents censored). (F) Heatmap of TIGD1 expression among stage, sex and grader. Black represents low expression and red represents high expression.