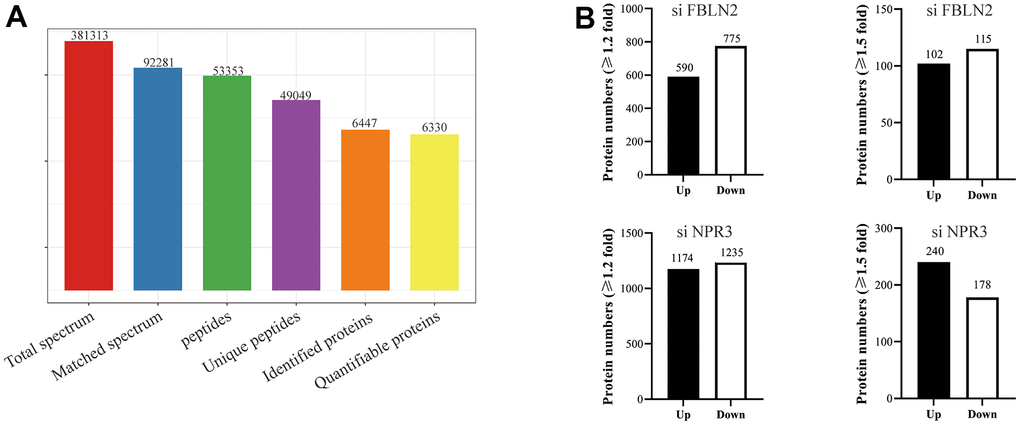
Figure 5.(A) Basic MS data in the statistical form; (B) Quantities of different protein expressions from the proteomics analyses on FBLN2 or NPR3 knockdown.
Figure 5 — TMT-based quantitative proteomic analysis revealed that FBLN2 and NPR3 are involved in the early osteogenic differentiation of mesenchymal stem cells (MSCs) | Aging