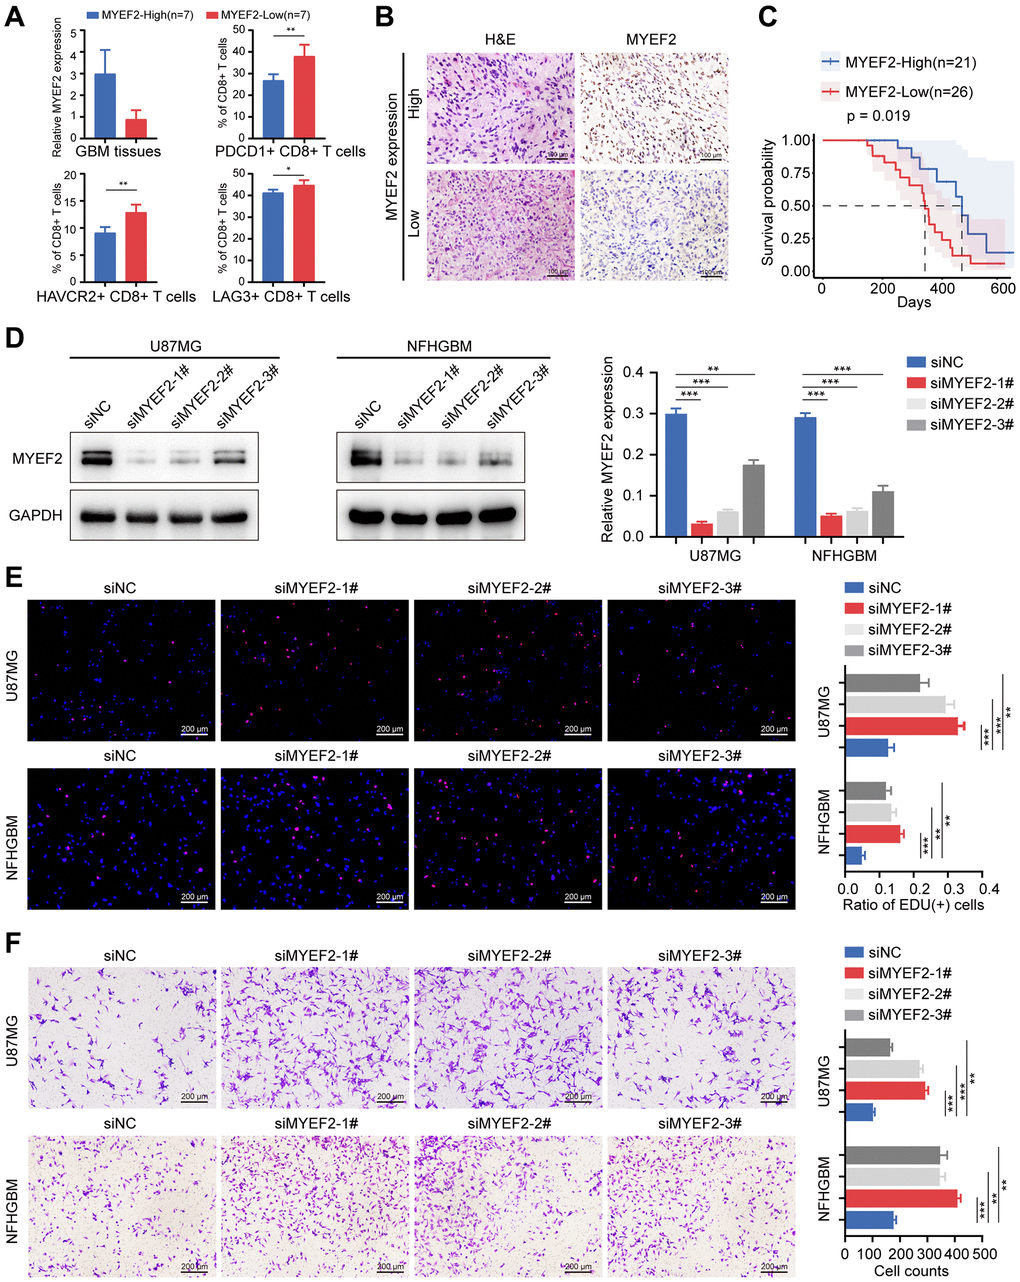
Figure 5.MYEF2 negatively correlates with GBM CD8+ T cells exhaustion and tumor progression. (A) Bar graph of the qRT-PCR of MYEF2 expression in GBM tissues (n = 14) and percent of PDCD1, HAVCR2 and LAG3 expression on CD8+ T cell from MYEF2-High and MYEF2-Low samples as measured by flow cytometry. *P < 0.05, **P ≤ 0.001. (B) Representative images of MYEF2 immunohistochemical staining of GBM tissues. (C) Kaplan–Meier survival curve of NFH-GBM patients stratified by MYEF2 expression (according to IHC data). (D) Western blot assays showing MYEF2 knockdown efficiency in U87MG and NFHGBM cells. (E) EdU assay showing different cell proliferation rates in siMYEF2- and siNC-treated U87MG and NFHGBM cells. Error bars represent the SD of repeats of each cell. **P < 0.01, ***P < 0.001. (F) Transwell assay showing cell migration capacity in siMYEF2- and siNC-treated U87MG and NFHGBM cells. Error bars represent the SD of repeats of each cell. **P < 0.01, ***P < 0.001.