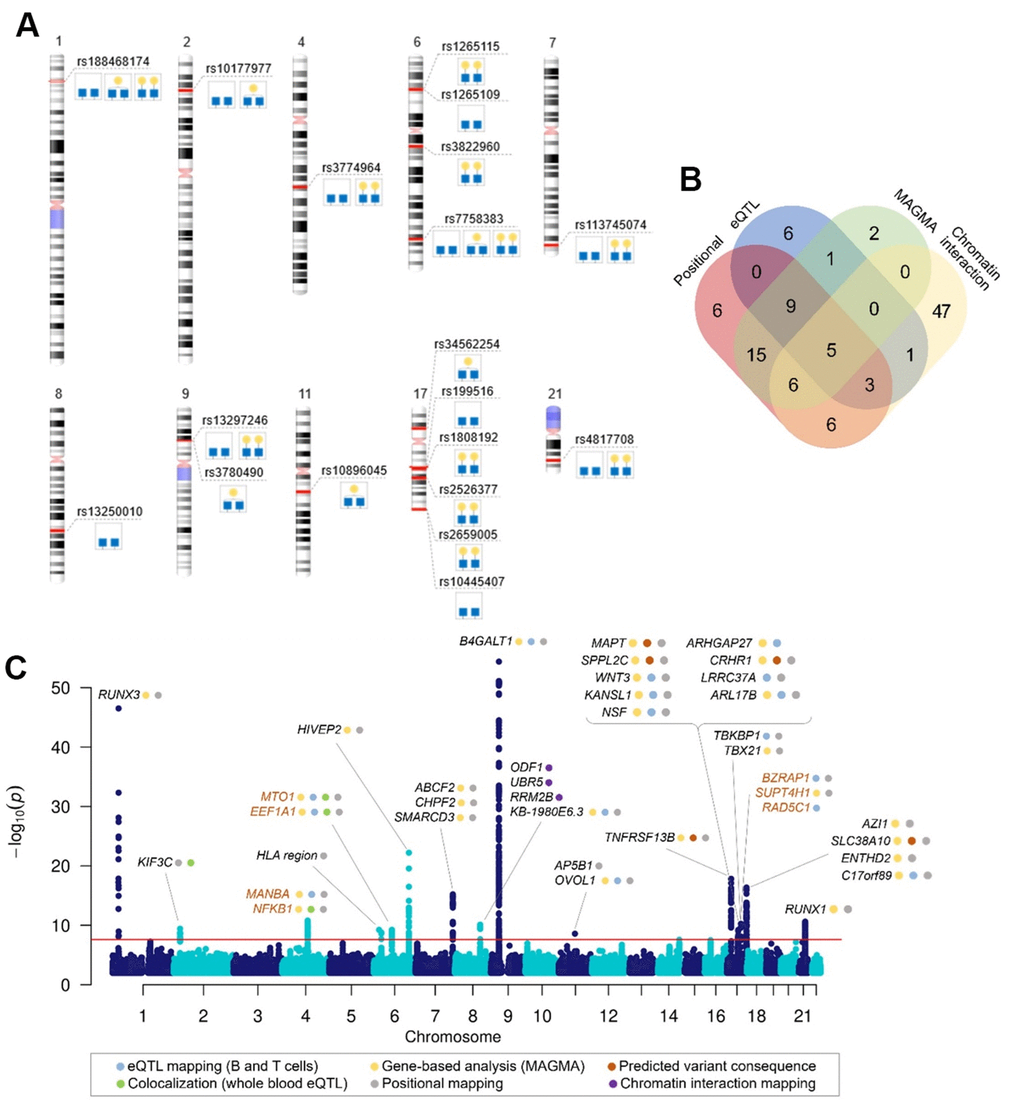
Figure 1.Genome-wide significant associations with galactosylation phenotypes. (A) Top SNP in identified genomic regions for each associated trait, (B) Venn diagram showing the number of genes mapped by positional mapping, chromatin interaction mapping, eQTL mapping and genome-wide gene-based association analysis (MAGMA), (C) Manhattan plot of genome-wide significant associations in IgG galactosylation GWAS with prioritized genes in each locus. Plot shows -log10(p-values) of association on y-axis and SNPs ordered by chromosomal location on x-axis. Red line indicates the genome-wide significance threshold (2.5 ×10⁻⁸). Orange gene names indicate novel loci associated with IgG glycosylation.