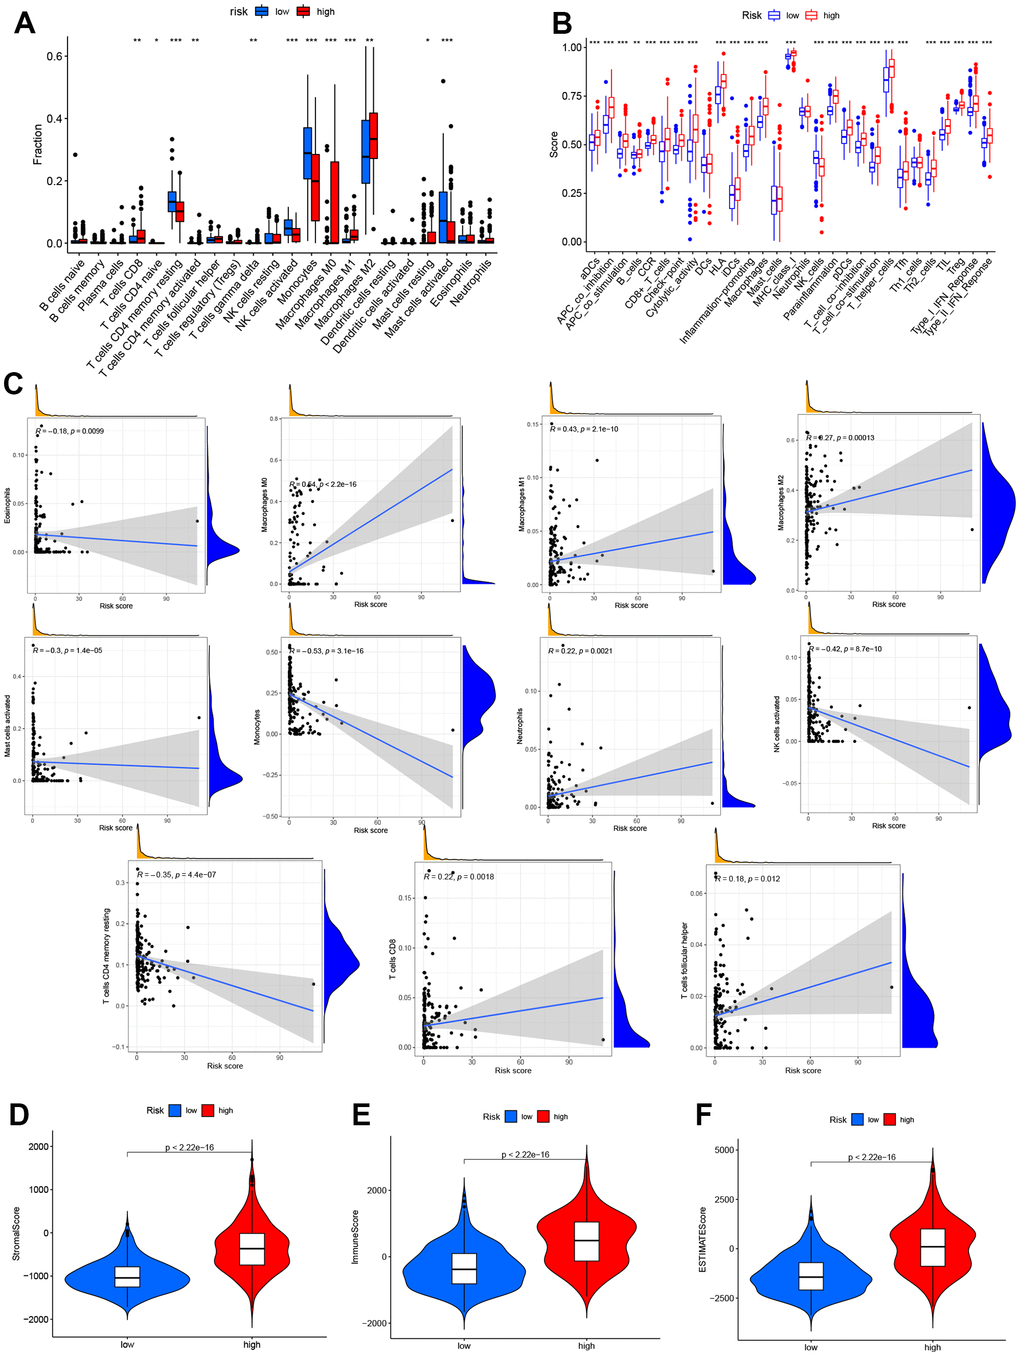
Figure 7.Analysis of immune activity in different groups. Comparison of immune cells, (A, B) various immune-correlated pathways. (B, C) Immune infiltrations of the risk model. (D–F) TME score of the two groups.
Figure 7 — A systematic framework for identifying prognostic necroptosis-related lncRNAs and verification of lncRNA CRNDE/miR-23b-3p/IDH1 regulatory axis in glioma | Aging