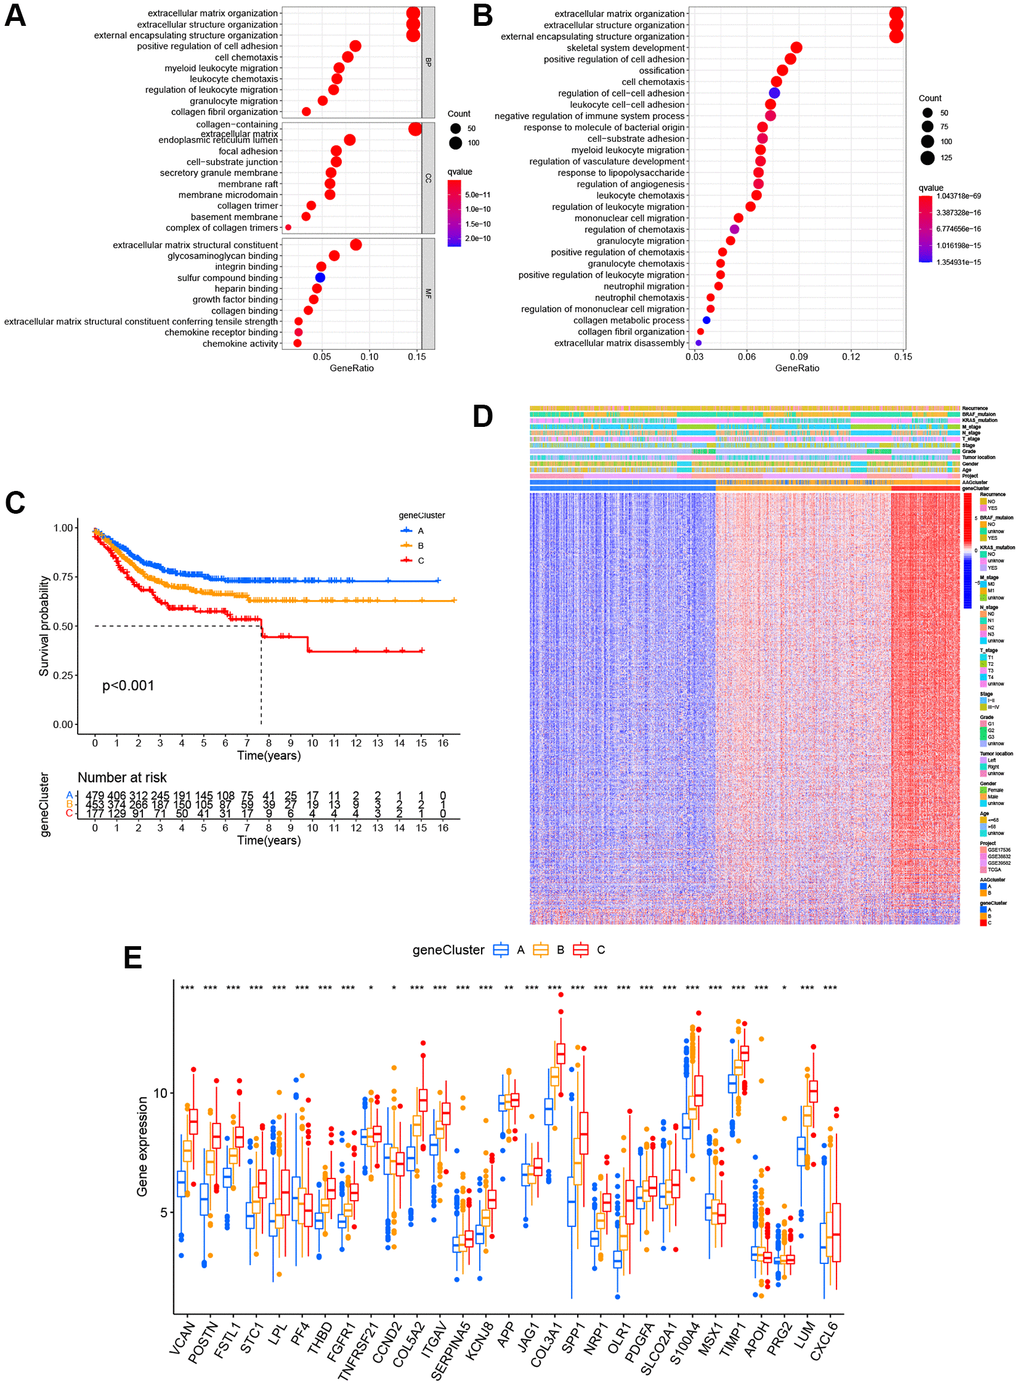
Figure 4.Identification of gene subgroups based on DEGs. (A, B) The bubble graph for Gene Ontology (GO) analysis and the barplot graph for Kyoto Encyclopedia of Genes and Genomes (KEGG) analysis in the two ARG subtypes. (C) Kaplan–Meier curves for the RFS of the three gene subtypes. (D) Relationships between clinicopathologic characteristics and the three gene subtypes. (E) Differences in the expression of 36 ARGs among the three gene subtypes. *P < 0.05; **P < 0.01; ***P < 0.001.