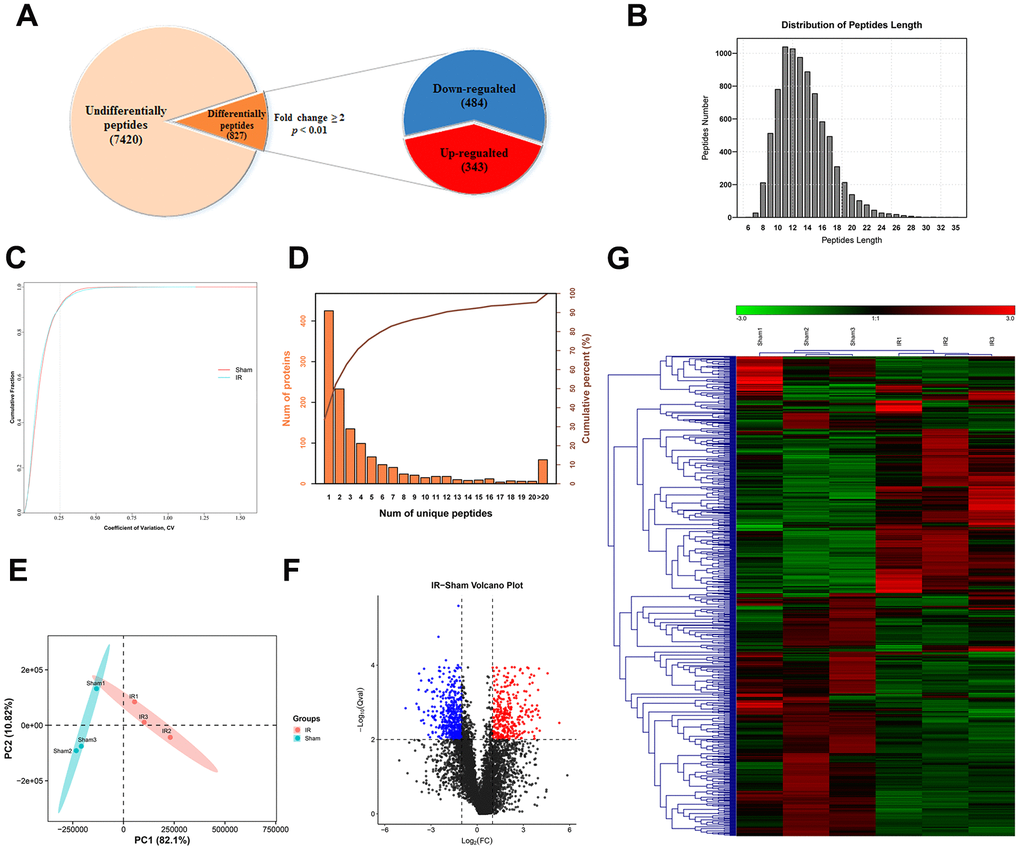
Figure 2.General characteristic of DEPs identified by LC-MS/MS. (A) Among the 8246 peptides screened, 827 DEPs were identified (fold change ≥ 2 and p < 0.01), included 343 upregulated and 484 downregulated peptides. (B) Peptide length distribution of DEPs. (C) Coefficient of variation of the sham operated and the I/R groups. (D) Number of unique peptide lengths. (E) Principal component analysis of the peptides identified in each tissue. (F, G) Volcano plot (F) and hierarchical clustering (G) of DEPs. The rows represent the expression profiles of DEPs, and the columns represent the corresponding tissue sample. The color red represents higher expression levels, whereas the color blue represents lower expression levels.