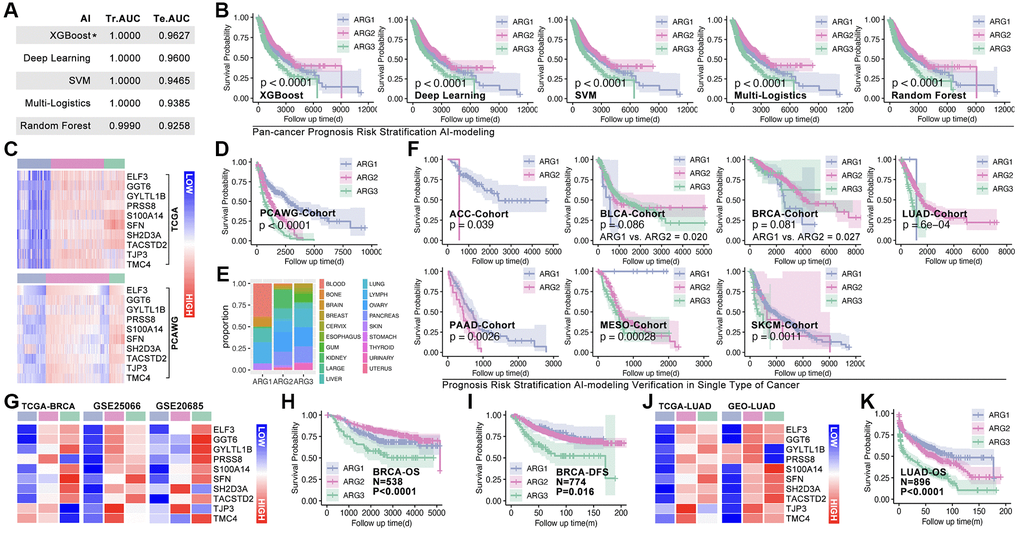
Figure 5.Machine learning identifies ARG subgroup. (A) TCGA cohort is divided into testing cohort (30%) and training cohort (70%), five types of machine learning algorithms are applied, and ROC (Tr.AUC means training AUC; Te.AUC means testing AUC) is used to assess the accuracy of models. (B) K-M analysis displays prognosis features amongst ARG subgroups. (C) Expression feature of Hubgenes in TCGA cohort and PCAWG cohort. (D) K-M analysis displays prognosis features amongst ARG subgroups in PCAWG cohort. (E) Pan-cancer distribution in ARG subgroups in PCAWG cohort. (F) AI-based ARG identification model recognizes ARG subgroups in single cancer in TCGA cohort, and K-M analysis shows prognosis features amongst ARG subgroups. (G) Expression feature of Hubgenes in breast cancer, whose data from TCGA and GEO cohorts. (H) Overall survival (OS) differences amongst ARG subgroups in GEO cohort (GSE20685, GSE42568). (I) Disease free survival (DFS) differences amongst ARG subgroups in GEO cohort (GSE21653, GSE25066). (J) Expression feature of Hubgenes in LUAD, whose data from TCGA and GEO cohorts. (K) OS differences amongst ARG subgroups in GEO cohort (GES30219, GSE231210, GSE37745, GSE50081).