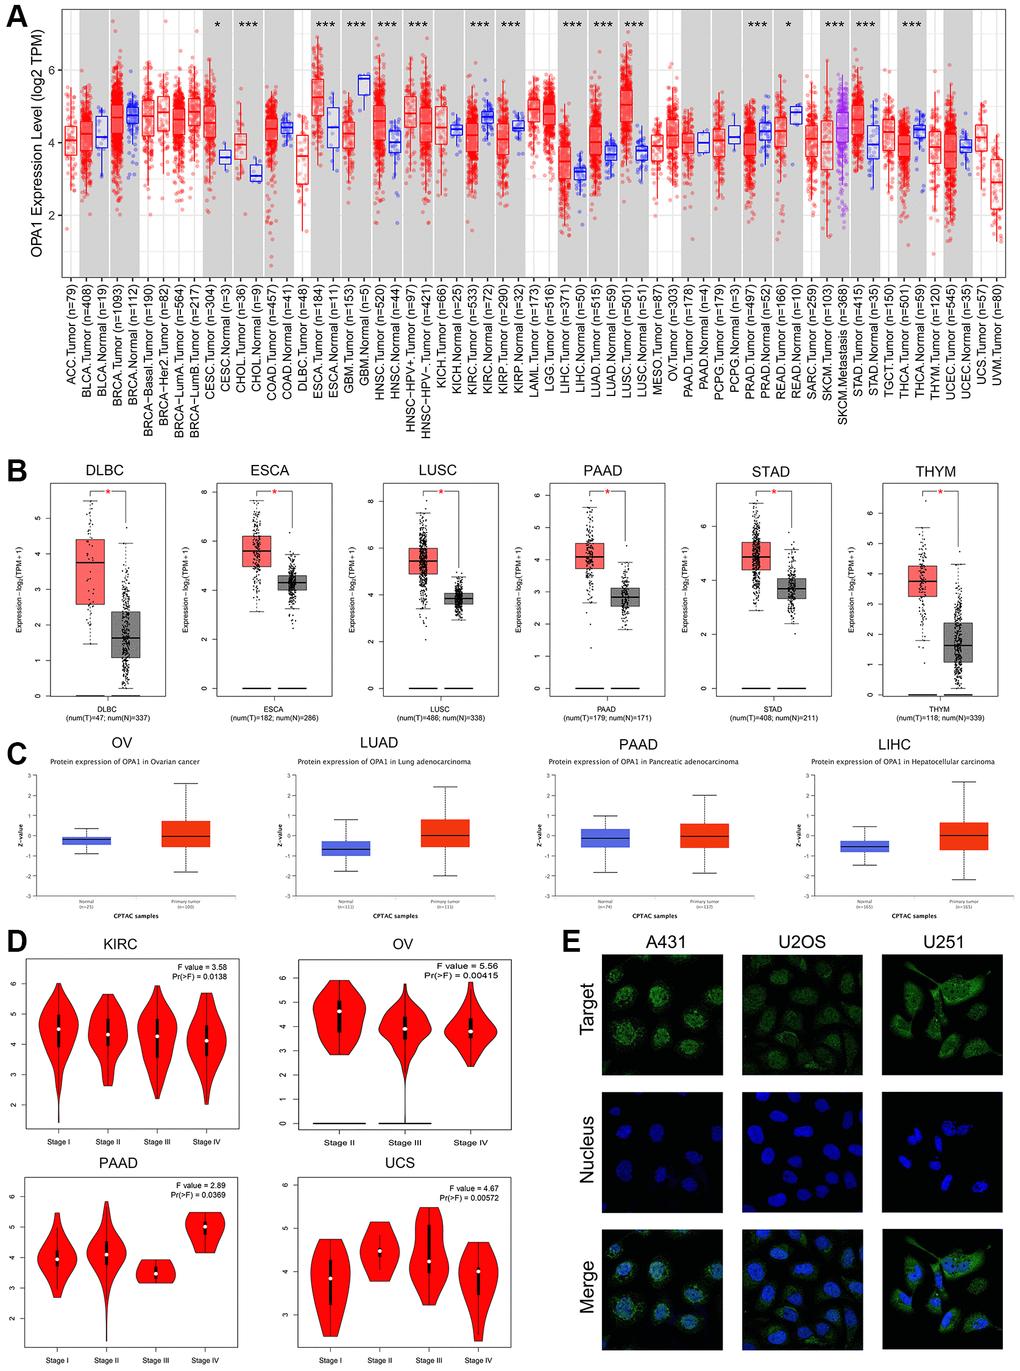
Figure 2.The expression levels of OPA1 in different tumors and normal samples. (A) The expression levels of the OPA1 gene in different tumors and paratumoral tissues were analyzed by TIMER2. *p < 0.05, **p < 0.01, ***p < 0.001. (B) The expression levels of the OPA1 gene in DLBC, ESCA, LUSC, PAAD, STAD, THYM, and the normal samples, were analyzed by GEPIA. *p < 0.05. (C) The protein expression of OPA1 in OV, LUAD, PAAD, LIHC, and the normal samples was analyzed by UALCAN. (D) The expression level of OPA1 in the different stages of KIRC, OV, PAAD, and UCS, was analyzed by GEPIA. (E) The immunofluorescence in osteosarcoma cell lines (A431, U2OS, and U251), was analyzed by HPA.