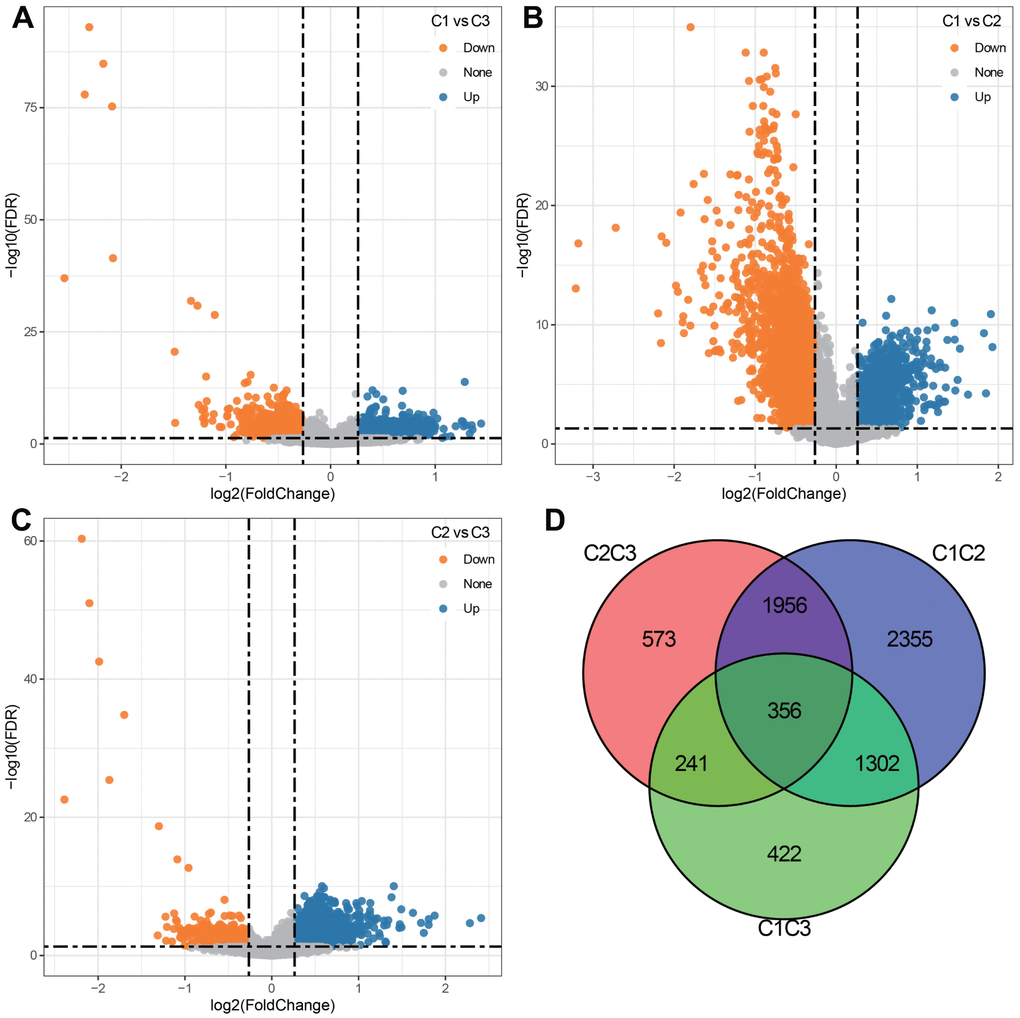
Figure 3.Differentially expressed genes (DEGs) among 3 clusters. (A) Volcano plot depicting DEGs between C1 and C3 groups (920 up-regulated and 1401 down-regulated). (B) Volcano plot depicting DEGs between C1 and C2 groups (1075 up-regulated and 4894 down-regulated). (C) Volcano plot depicting DEGs between C2 and C3 groups (2699 up-regulated and 427 down-regulated). (D) Venn diagram describing the intersection of DEGs among 3 clusters.