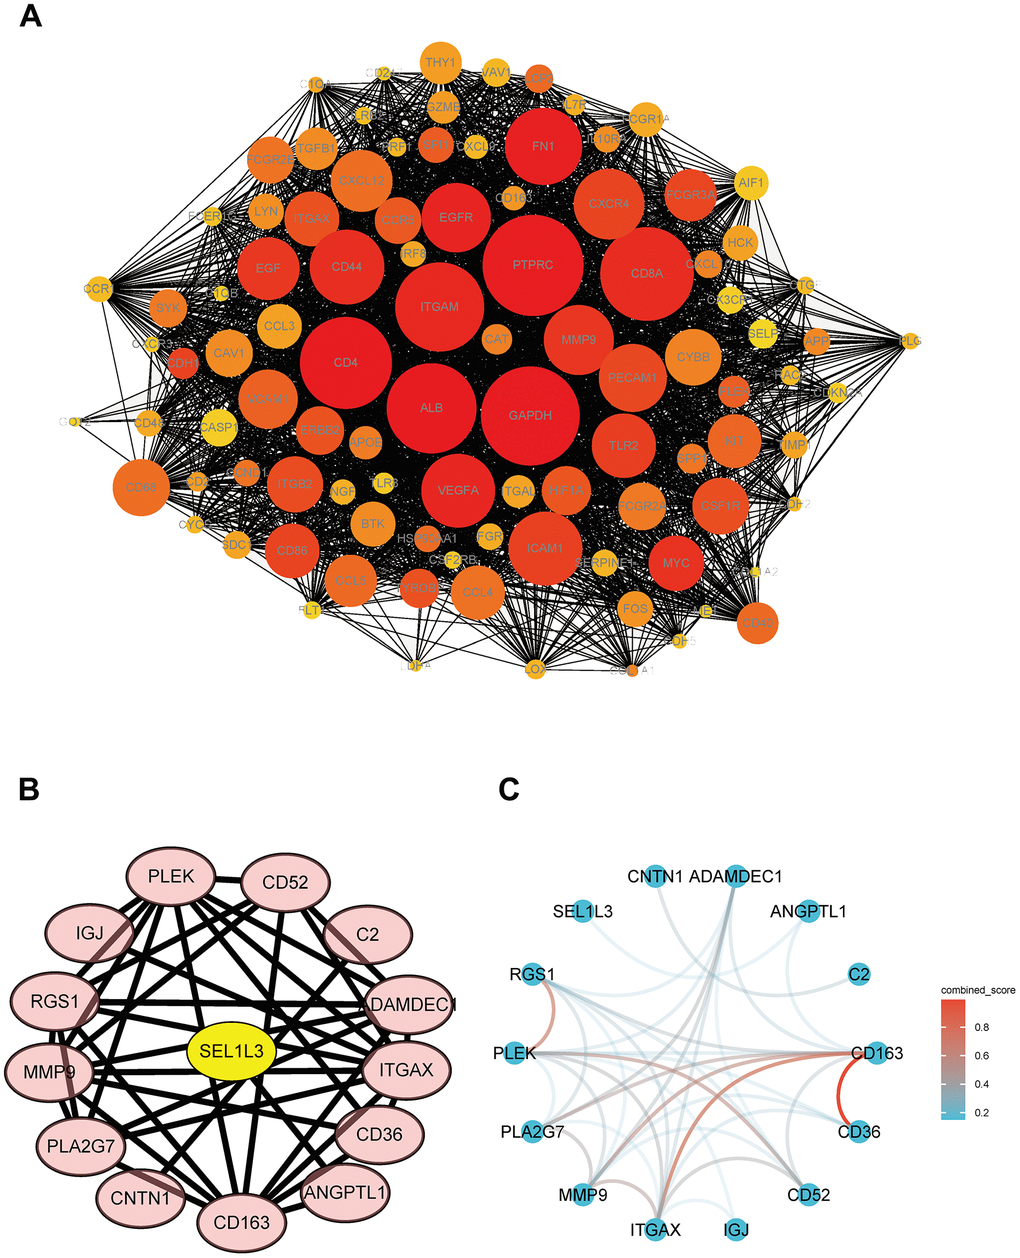
Figure 4.PPI network of DEGs and hub genes. (A) Total DEGs. (B) Protein interaction relationship by Cytoscape. (C) Protein interaction network colored by combine score.
Figure 4 — SEL1L3 as a link molecular between renal cell carcinoma and atherosclerosis based on bioinformatics analysis and experimental verification | Aging