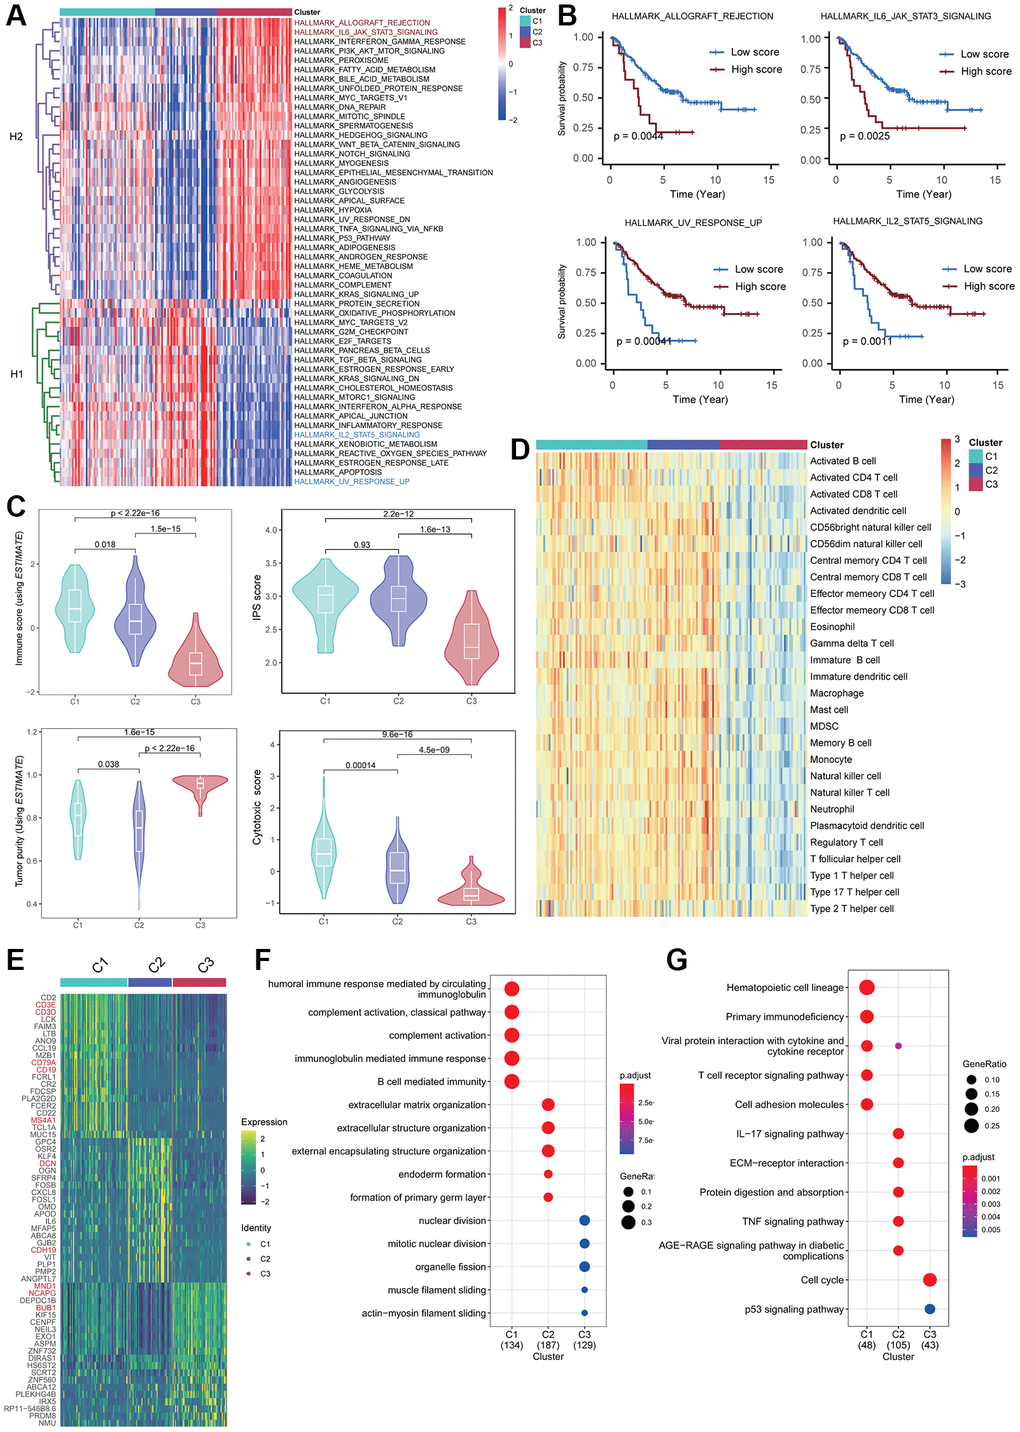
Figure 3.Biological heterogeneity across Fges-derived subtypes. (A) Heatmap displays the activity scores of cancer hallmark pathways for Cluster 1, Cluster 2, and Cluster 3 subtypes. These pathways were collected from MSigDB database, and can be classified into two categories, H1 and H2. (B) KM curves demonstrate the significant impact of high activity in the four cancer hallmark pathways on the prognosis of NB patients. The p-values were obtained through log-rank tests. (C) Violin plots show the distribution of different biological features in the three Fges-derived subtypes, including immune score, IPS, tumor purity, and cytotoxic score. P-values were obtained by a t-test. (D) Heatmap of activity scores of 28 immune cell gene sets provided by a previous study [44], among the Fges-derived subtypes. (E) Heatmap shows the expression of the top 20 highly expressed genes among three Fges-derived subtypes. (F) Bubble plot shows the biological processes significantly involved in the three Fges-derived subtypes of NB. (G) Bubble plot shows the pathways significantly involved in the three Fges-derived subtypes of NB.