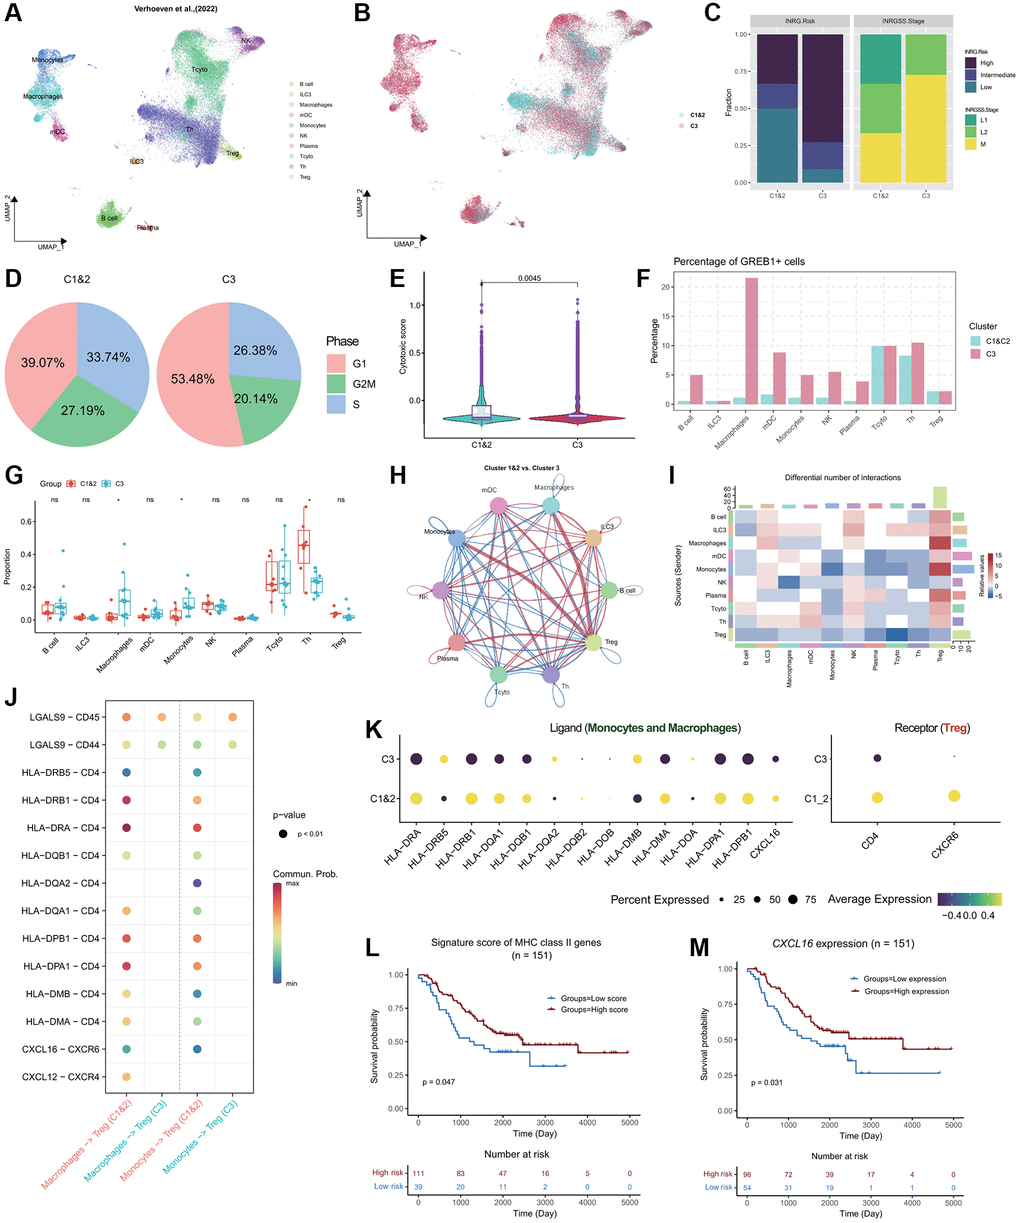
Figure 6.Single-cell profiling of the NB immune microenvironment and subtype-specific interactions. (A) Global overview of NB immune cell atlas containing 46,134 cells, color coded by annotated cell type (n = 17). (B) Global overview of NB immune cell atlas, color coded by predicted NB subtypes. (C) Stacked bar plots showing the distribution of Cluster 1&2 and Cluster 3 subtypes of NB patients in the INRG (left panel) and INRGSS (right panel) classifications. (D) Pie plots showing the percentage of cells in different NB subtypes in the G1, G2M, and S phases. (E) Violin plots combined with boxplots show the distribution of cytotoxic scores of cells in Cluster 1&2 and Cluster 3 subtypes. P-value was obtained from t-test. (F) Grouped bar plot showing the percentage of GREB1+ cells in different immune cell types of Cluster 1&2 and Cluster 3 patients. (G) Grouped boxplot showing the cellular proportion of Cluster 1&2 and Cluster 3 patients. P-values were obtained from t-tests. ns, not significant; *p < 0.05. (H) Interaction map depicting the ligand-receptor interactions within the NB immune microenvironment. Red indicates stronger interactions between ligands and receptors in Cluster 1&2 compared to Cluster 3, while blue indicates weaker interactions in Cluster 1&2 compared to Cluster 3. The thickness of the lines represents the strength of the differences. (I) Heatmap showing the differences in ligand-receptor interactions between Cluster 1&2 and Cluster 3. Red indicates stronger interactions between ligands and receptors in Cluster 1&2 compared to Cluster 3, while blue indicates weaker interactions in Cluster 1&2 compared to Cluster 3. (J) Bubble plot showing the significant interactions between receptor and ligand genes among Monocytes, Macrophages, and Treg cells in both Cluster 1&2 and Cluster 3 subtypes (p < 0.01). The color gradient ranging towards red indicates stronger interactions. (K) Bubble plot showing the expression of ligands MHC II molecules and CXCL16 in Monocytes and Macrophages of both Cluster 1&2 and Cluster 3 subtypes, as well as the expression of receptor genes CD4 and CXCR6 in Treg cells. (L) KM curve showing the stratification derived by the signature score of MHC Class II genes exhibiting significant differences in prognosis. P-value was obtained by log-rank test. (M) KM curve showing the stratification derived by the expression of CXCL16 exhibiting significant differences in prognosis. P-value was obtained by log-rank test.