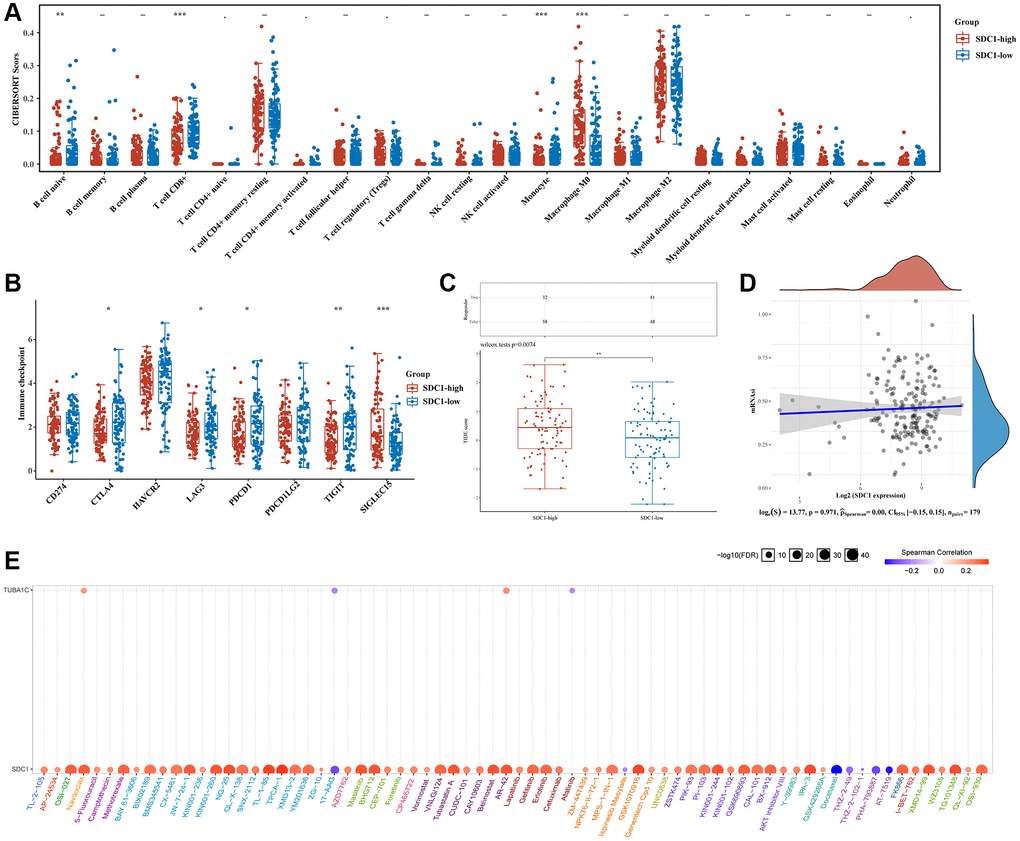
Figure 11.Comparison of immune status and stemness between groups that express high and low levels of SDC1. (A) An analysis of immune infiltration was obtained using the CIBERSORT algorithm for the high expression group of SDC1 and the low expression group of SDC1; the horizontal axis represents immune cells, while the vertical axis displays immune scores (*p < 0.05, **p < 0.01, ***p < 0.001). (B) Comparison of immune-checkpoint gene expression in SDC1 high expression group and SDC1 low expression group. (C) Table showing immune response statistics and immune response scores for different groups. (D) With the OCLR algorithm, SDC1 low expression, and SDC1 high expression groups were compared for stemness. (E) The correlation between SDC1/TUBA1C and GDSC drug sensitivity in PC.