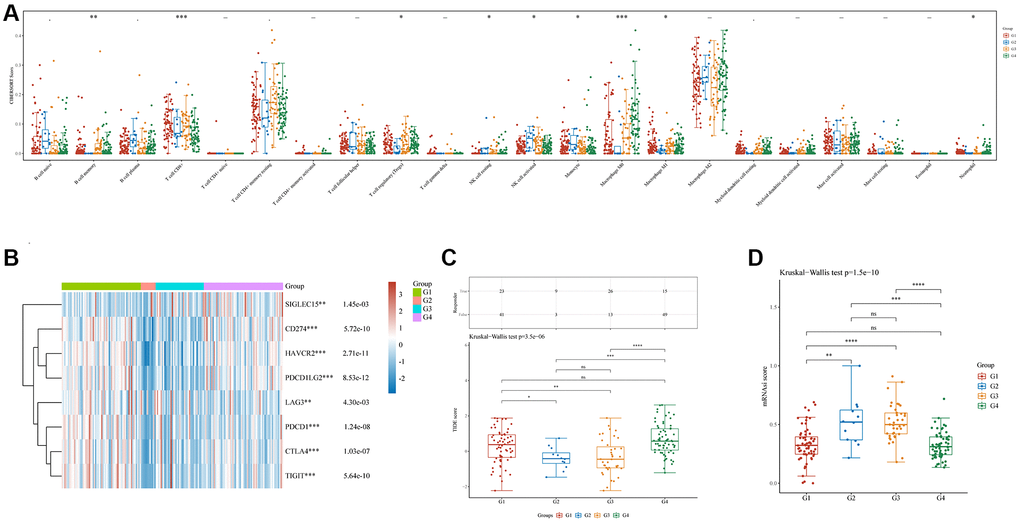
Figure 4.Immune and stemness analysis in four clusters. (A) Analysis of immune infiltration by C1, C2, C3, and C4 based on the CIBERSORT algorithm; the horizontal axis represents immune cells, while the vertical axis displays immune scores (*p < 0.05, **p < 0.01, ***p < 0.001). (B) Comparison of immune-checkpoint gene expression in C1, C2, C3, and C4; the horizontal axis shows different immune checkpoint genes, while the vertical axis displays the expression level (*p < 0.05, **p < 0.01, ***p < 0.001). (C) A statistical table showing the immune response and the distribution of scores for the different groups, according to the prediction. (D) A comparison of stemness for C1, C2, C3, and C4 using mRNAsi scores and the OCLR algorithm.