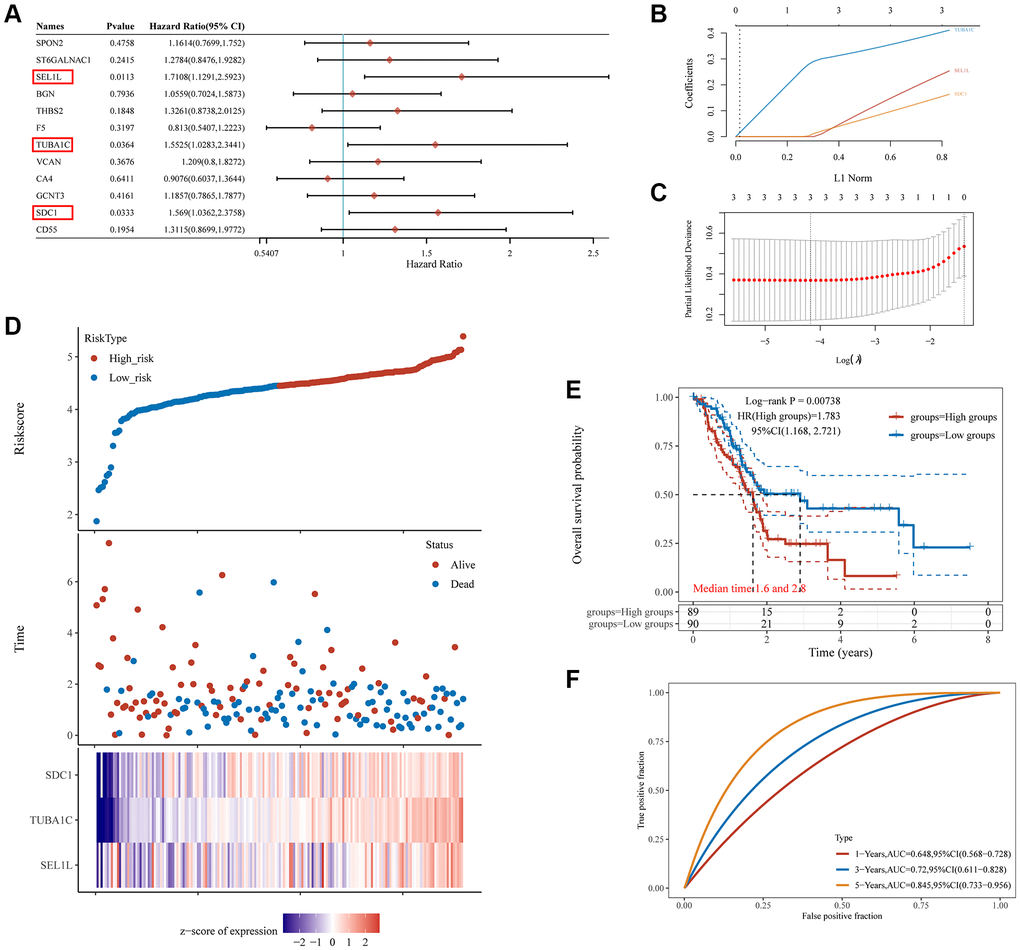
Figure 5.The prognostic signature of PC based on 3 GRGs in the TCGA database. (A) Log-rank test identifies 3 GRGs correlated to OS in PC patients. (B) Lambda parameter shows the coefficients of 3 GRGs. Lambda is represented horizontally, while coefficients are represented vertically. (C) The partial likelihood deviance versus log(λ) was calculated using the LASSO Cox regression model. (D) The relationship between risk score and living status. Graphs in the middle indicate the risk score, scatter diagrams in the middle, and gene expression heat maps below. (E) The KM survival curve of the risk model in the TCGA data set. Several groups were tested by log-rank and HR (high expression), representing the risk factors of high expression versus low expression. (F) ROC curves for the risk model and AUCs over various periods (one year, three years, five years). Plots revealed better consistency between the nomogram predictions and actual observations (Figure 7D).
Figure 5 — A glycosylation-related signature predicts survival in pancreatic cancer | Aging