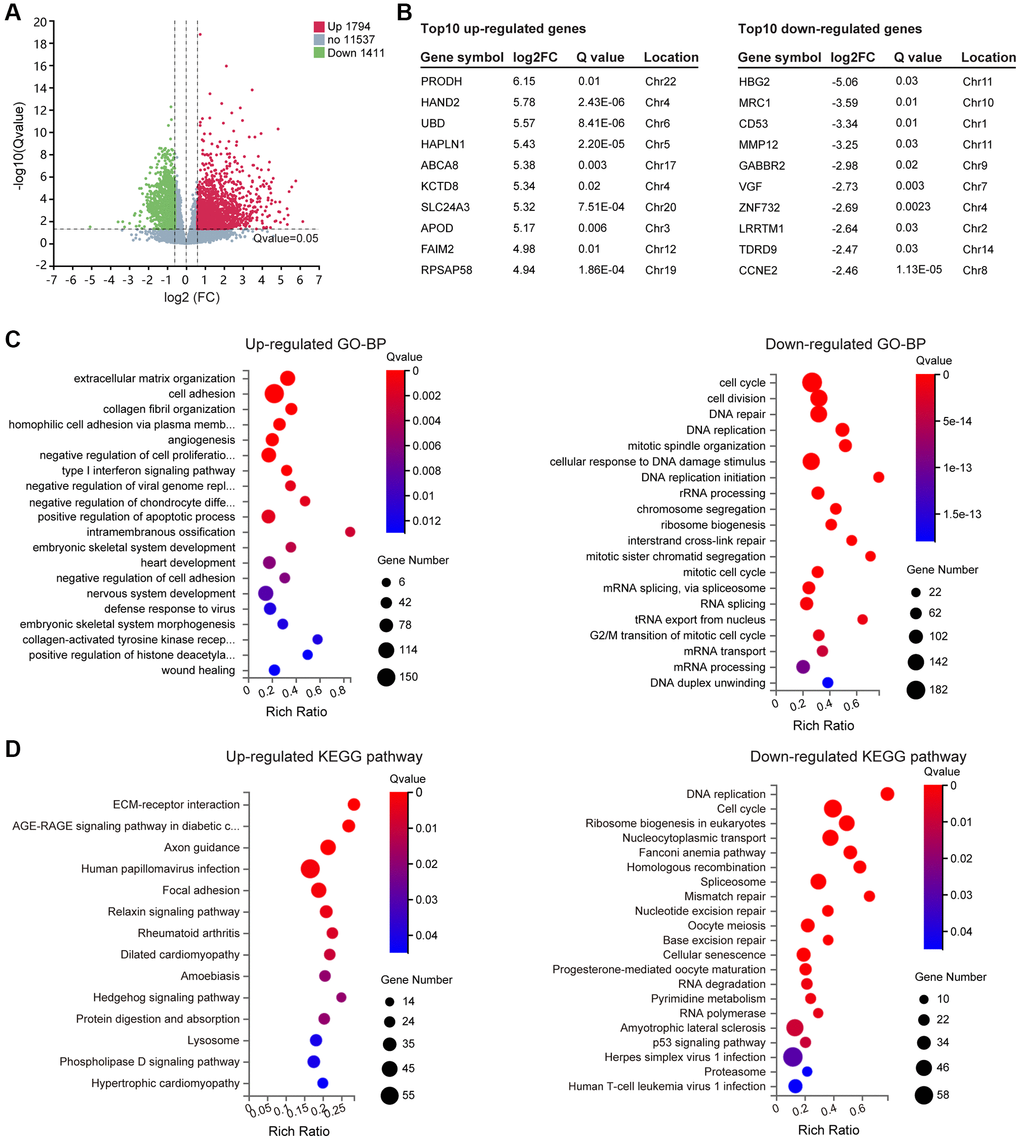
Figure 2.Differentially expressed genes (DEGs) screening and enrichment analysis. (A) Volcano plot of all expressed genes in Normal versus Trisomy. DEGs were filtered through the Fold change ≥1.5 and Q value ≤ 0.05. Dots represent individual genes, with upregulated genes in red, downregulated genes in green and others in gray. (B) List of the top 10 up- and downregulated genes in the DEG gene set. (C) GO enrichment of biological processes (BP) analysis of annotated DEGs; the top 20 are listed. (D) KEGG pathway enrichment analysis of annotated DEGs.