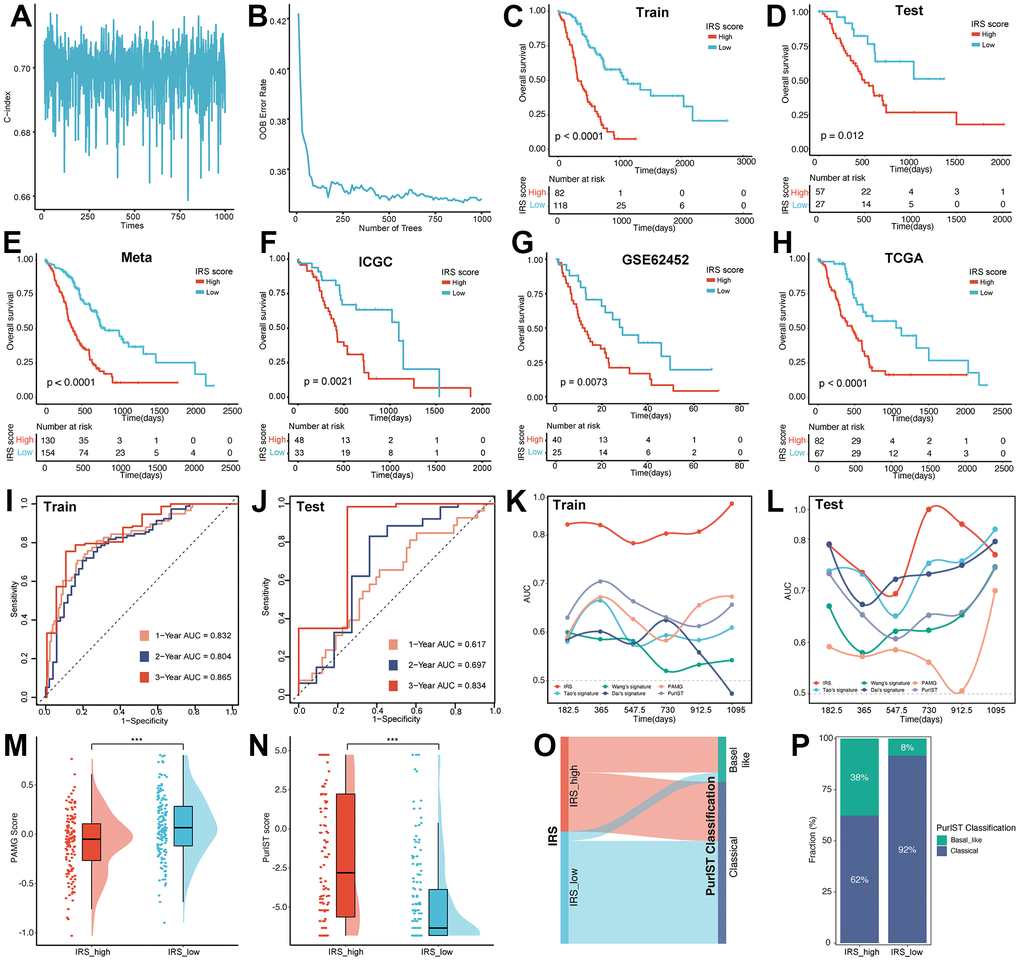
Figure 3.Construction of the IRS. The alteration of C index (A) and OOB rate (B) during 1000-times iteration. The survival analysis was performed based on the training set (C), testing set (D), meta-cohort (E), ICGC (F), GEO (G) and TCGA (H) datasets, respectively. The predictive efficiency of IRS was validated in training set (I), testing set (J). AUC value was used for the comparison of IRS with other five signatures in the training (K) and testing set (L). The distribution of PAMG score (M) and PurIST score (N) between IRS_high and IRS_low group. (O) Sankey plot illustrated the distribution of IRS and PurIST classification. (P) Distribution of PurIST classification was compared between IRS_high and IRS_low group.