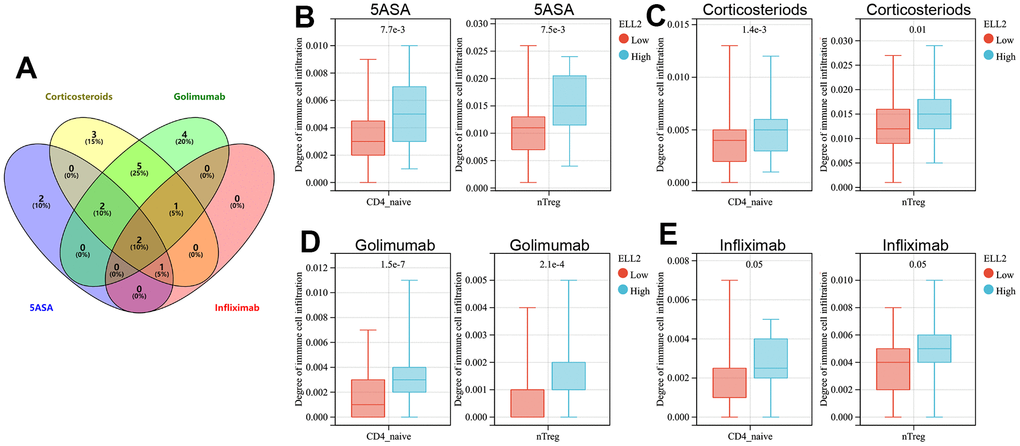
Figure 5.(A) The Venn diagram displays immune cells with differential infiltration between high and low levels of ELL2 expression across all treated cohorts. The differences in infiltration of B cells and iTregs between patients with high and low levels of ELL2 in UC cohorts treated with 5-ASA (B), corticosteroid (C), golimumab (D), and infliximab (E).