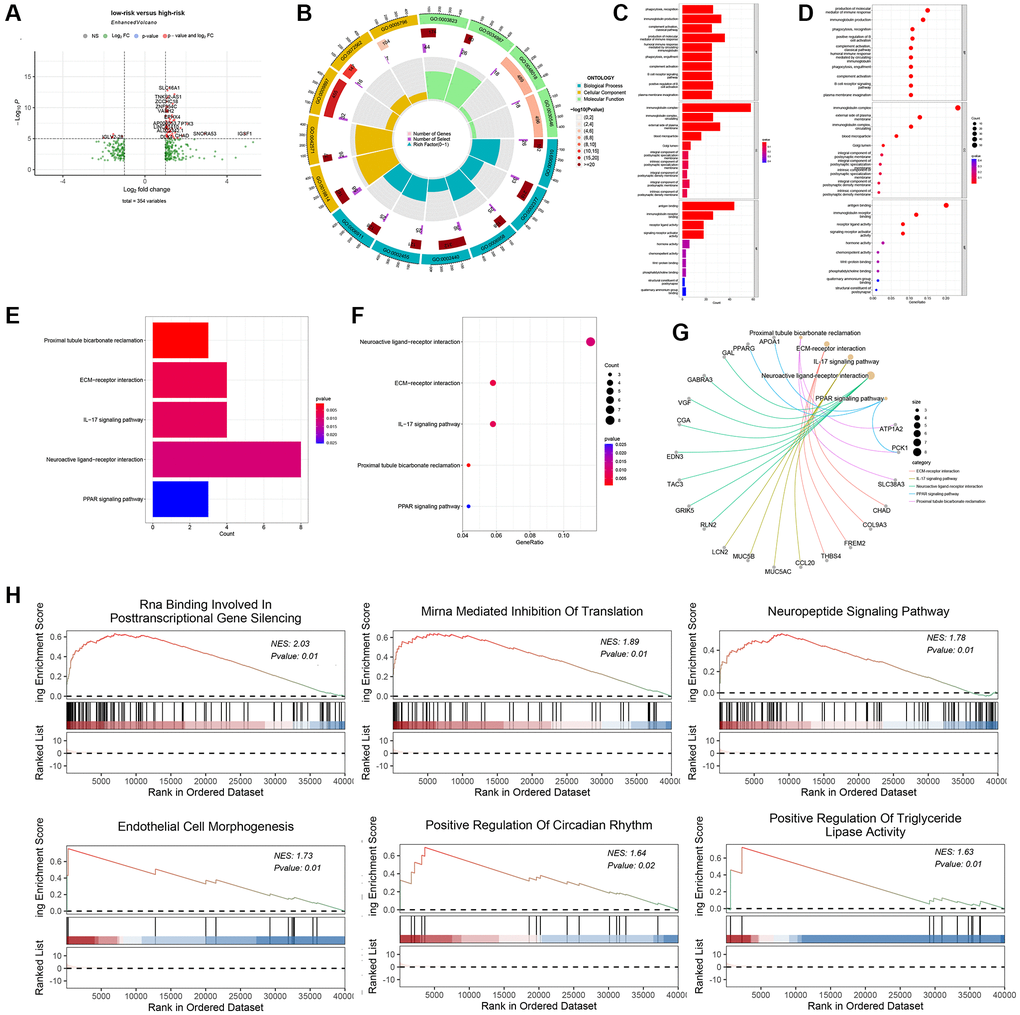
Figure 4.Biological function, and mechanism analysis. (A) Volcano plot of differentially-expressed genes (DEGs) between the high-risk group and low-risk group. (B) GO Circle plot (red, upregulated genes; blue, downregulated genes) show that Top 15 enriched GO terms in the BP category. (C) and (D) Plot of the enriched GO terms Go enrichment analysis for associated mRNAs with risk grouping. Y-axis represents the enriched GO terms; X-axis (C) represents the amount of the related mRNAs enriched in GO terms; X-axis (D) represents the ratio of the related mRNAs enriched in GO terms. (E) represents the amount of the related mRNAs enriched in KEGG pathways, X-axis. (F) represents the ratio of the related mRNAs enriched in KEGG pathways. (G) DEGs associated with the significant KEGG pathway. (H) GSEA showing the top six most significantly enriched signaling pathways.