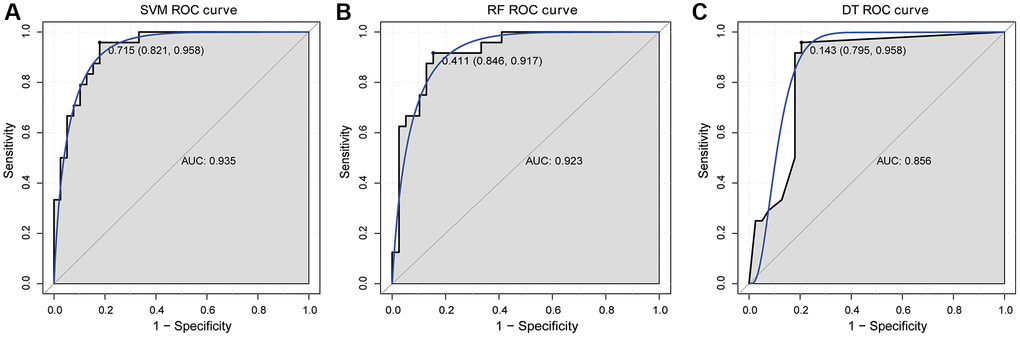
Figure 5.ROC curve validation of SVM (A), RF (B) and DT (C) classification models in GSE16561 dataset.
Figure 5 — Reveal the correlation between hub hypoxia/immune-related genes and immunity and diagnosis, and the effect of SAP30 on cell apoptosis, ROS and MDA production in cerebral ischemic stroke | Aging