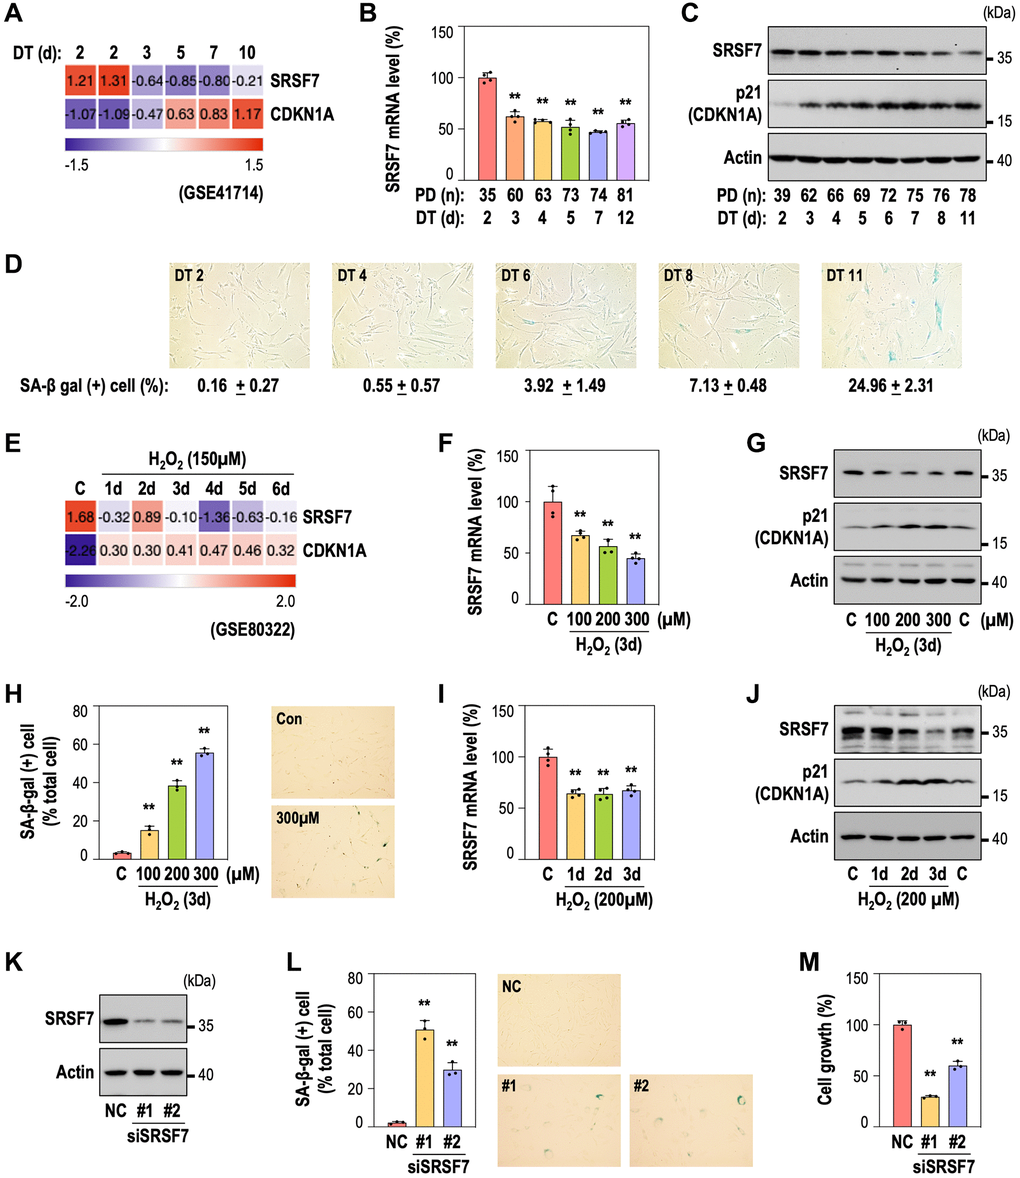
Figure 2.SRSF7 depletion is involved in diverse models of cellular senescence. (A–D) Expression of SRSF7 and senescence markers (CDKN1A, or p21 as its protein name, and SA-β gal activity) in RS model of HDFs. (A) Expression heatmap from publicly available microarray data (GSE41714). The values are scaled into z-score. (B) mRNA level of SRSF7 using qPCR. (**p < 0.01 vs. DT2 by student t-test). (C) Western blot analysis. (D) The percentage of SA-β-gal positive (+) cells along with pictures of stained cells. (E–J) Expression of SRSF7 and the same senescence markers in OSIS model of HDFs. (E) Expression heatmap from publicly available microarray data (GSE80322). The values are scaled into z-score. (F) mRNA level of SRSF7 in dose-dependent OSIS using qPCR. (**p < 0.01 vs. Con by student t-test). (G) Western blot analysis in dose-dependent OSIS. (H) The quantification of SA-β-gal (+) cells along with pictures of stained cells. (**p < 0.01 vs. Con by student t-test). (I) mRNA level of SRSF7 in time-dependent OSIS using qPCR. (**p < 0.01 vs. Con by student t-test). (J) Western blot analysis in time-dependent OSIS. (K–M) HDFs (DT2) were transfected with siRNA against either negative control (NC) or SRSF7 for 4 days. (K) Western blot analysis. (L) The quantification of SA-β-gal (+) cells along with pictures of stained cells. (**p < 0.01 vs. NC by student t-test). (M) The quantification of cell growth activity. (**p < 0.01 vs. NC by student t-test).