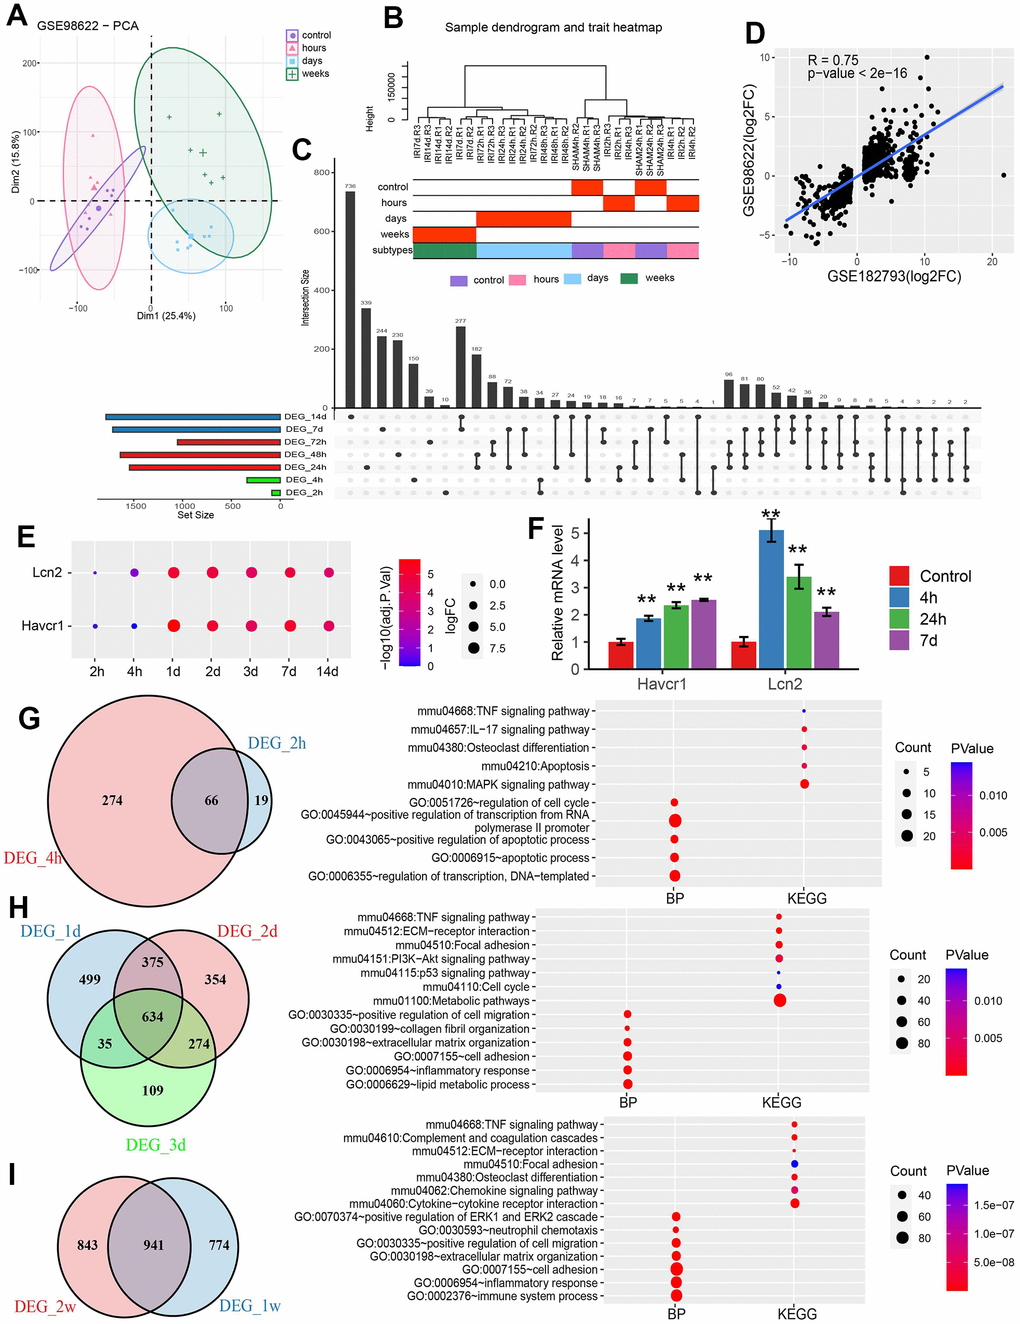
Figure 2.Differential analysis for GESE98622. (A) PCA plot of GSE98622. (B) Sample clustering of GSE98622. (C) The upset plot of DEGs was identified at each time point. (D) The scatter plot of DEGs in GSE98622 and GSE182793 after IRI 24h. (E) The dotplot of two AKI marker genes. (F) The qRT-PCR results of two well-known IRI related genes in the mouse IRI group and the normal group. * P<0.05, **P<0.01. (G) The common DEGs and functions in the hour group. (H) The common DEGs and functions in the day group. (I) The common DEGs and functions in the week group.