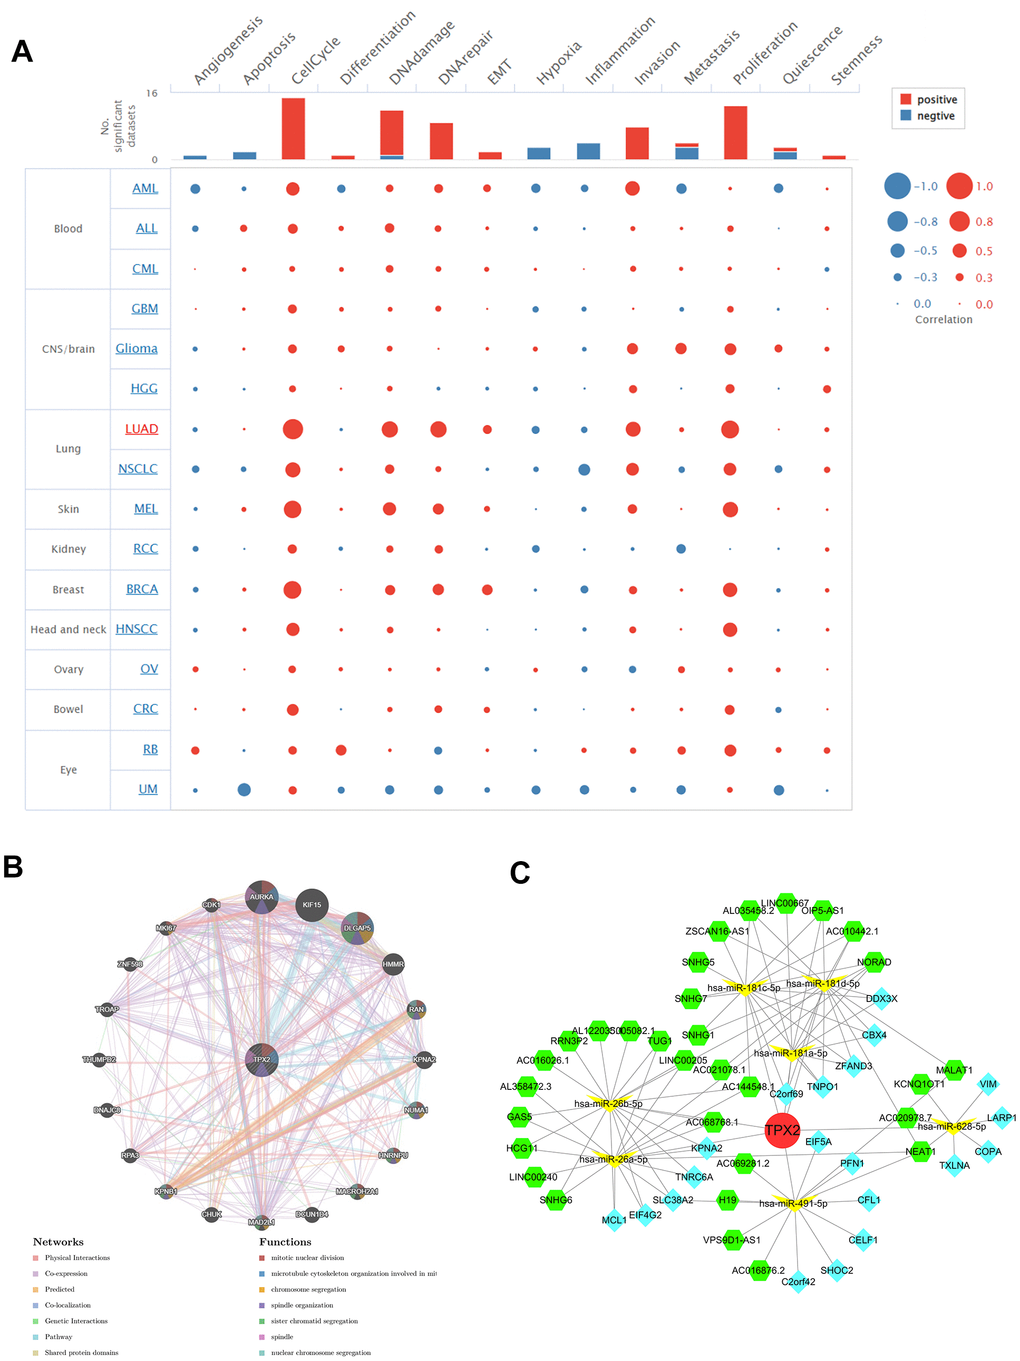
Figure 12.(A) Single-cell functional analysis of TPX2 from the CancerSEA database. (B) A gene-gene interaction network analysis of TPX2 from GeneMANIA database. (C) CeRNA networks of TPX2. Red circle represents the hub gene. Yellow vs represents the miRNAs. Green hexagons represent the lncRNAs. Blue quadrangles represent the circRNAs.