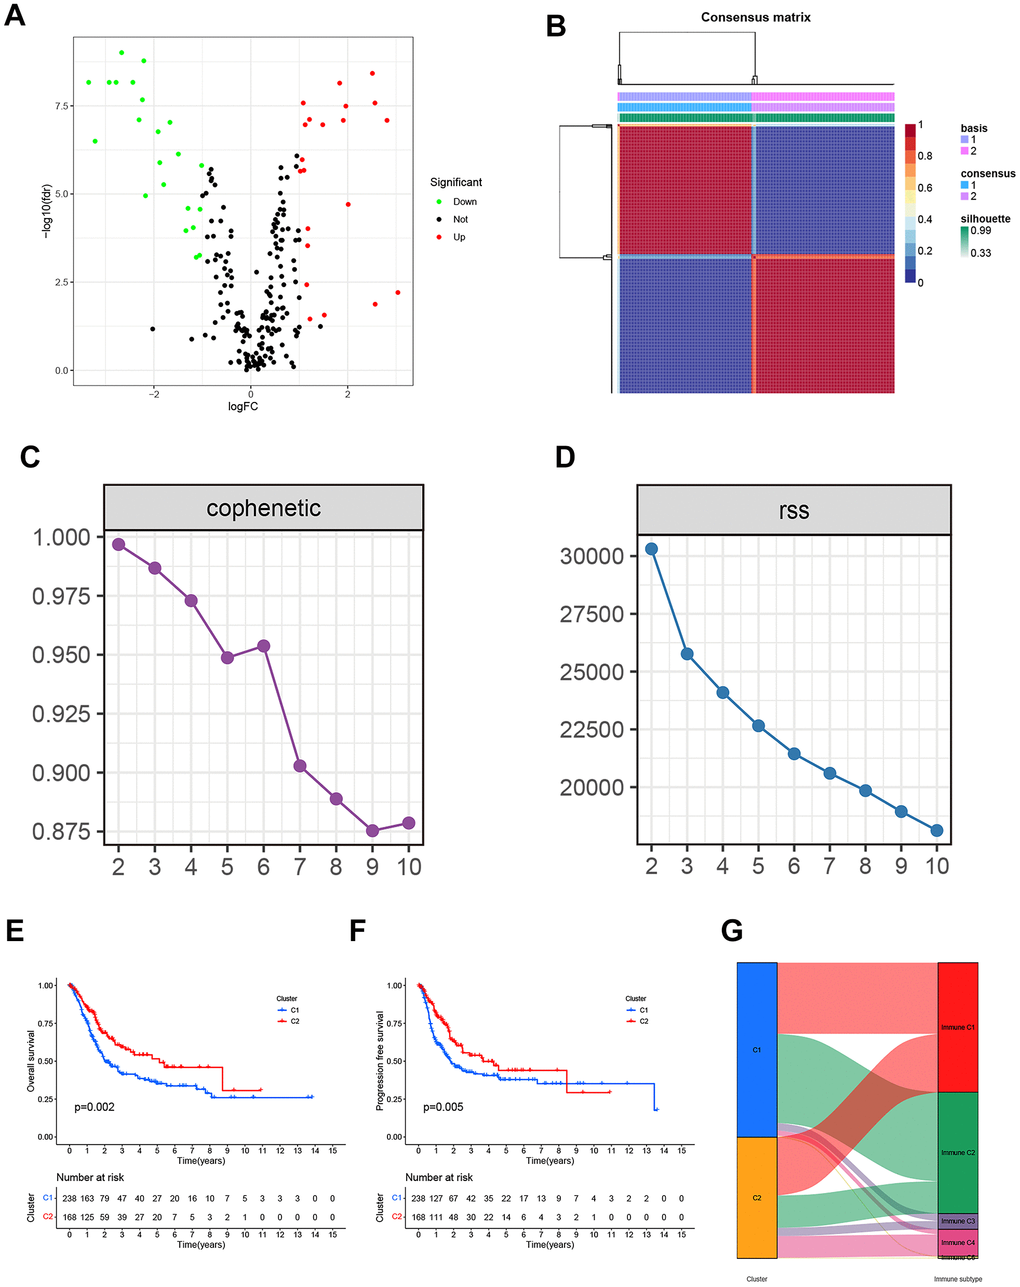
Figure 2.(A) The Volcano plot of differentially expressed genes from the BLCA patients in the TCGA database. (B) Non-negative matrix factorization (NMF) algorithm-based Consensus map clustered. (C) The stability of the cluster obtained from NMF was determined by the cophenetic correlation coefficient. (D) The clustering performance of the model was measured by RSS. (E, F) The statistical differences between C1 and C2 in overall survival (OS) and progression-free survival (PFS). (G) The mapping relationship of C1 and C2 to molecular subtypes was exhibited in the Alluvial plot.