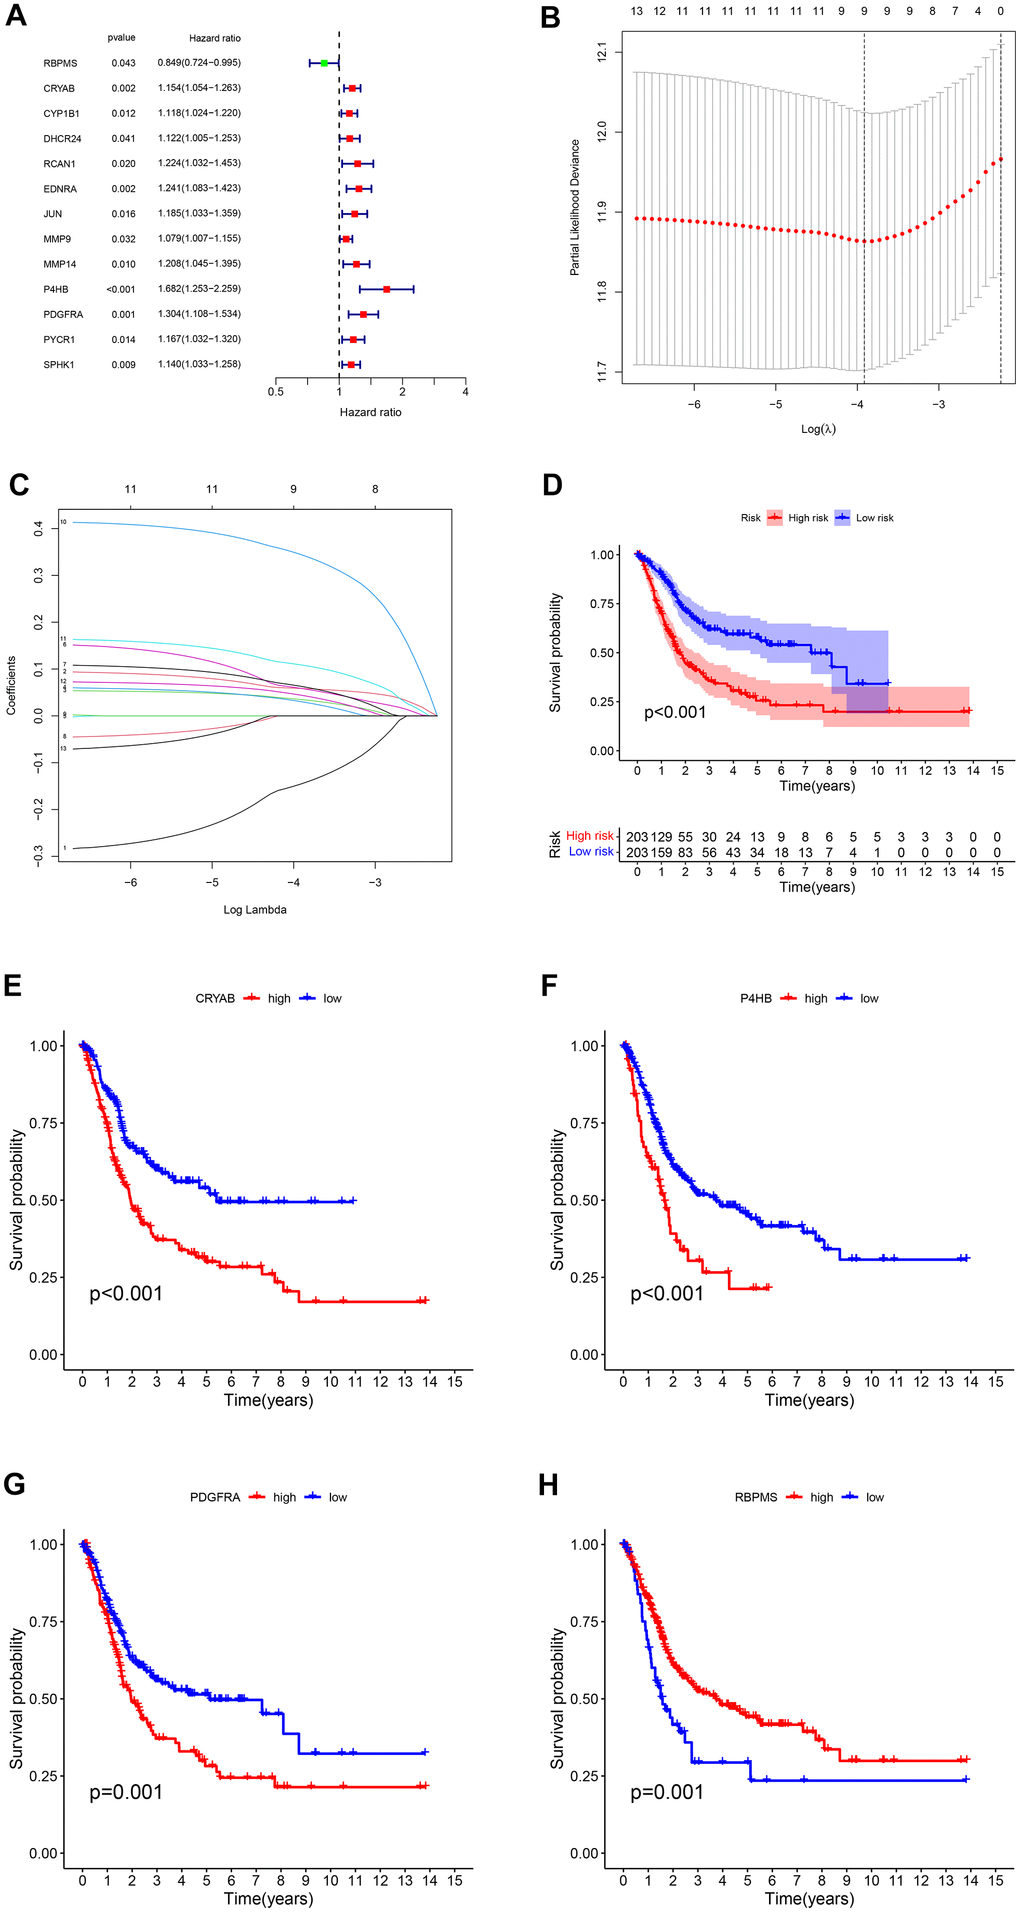
Figure 4.(A) The survival showed as Hazard ratio was determined by univariate Cox regression analysis in Forest plot. (B) Ten-fold cross-validation for tuning parameter selection in lasso regression. Vertical lines are drawn from the best data according to the minimum criterion and 1 standard error criterion. The vertical lines on the left represent the final 4 genes identified. (C) LASSO coefficient profiles of 13 OS-related genes. The 10-fold cross-validation value is marked by a vertical line. (D) The statistical difference exists in the overall survival between high-risk and low-risk groups as shown in the Kaplan-Meier curve. (E–H) The different overall survival between low and high CRYAB, P4HB, PDGFRA, and RBPMS expression was shown in the Kaplan-Meier curve respectively.