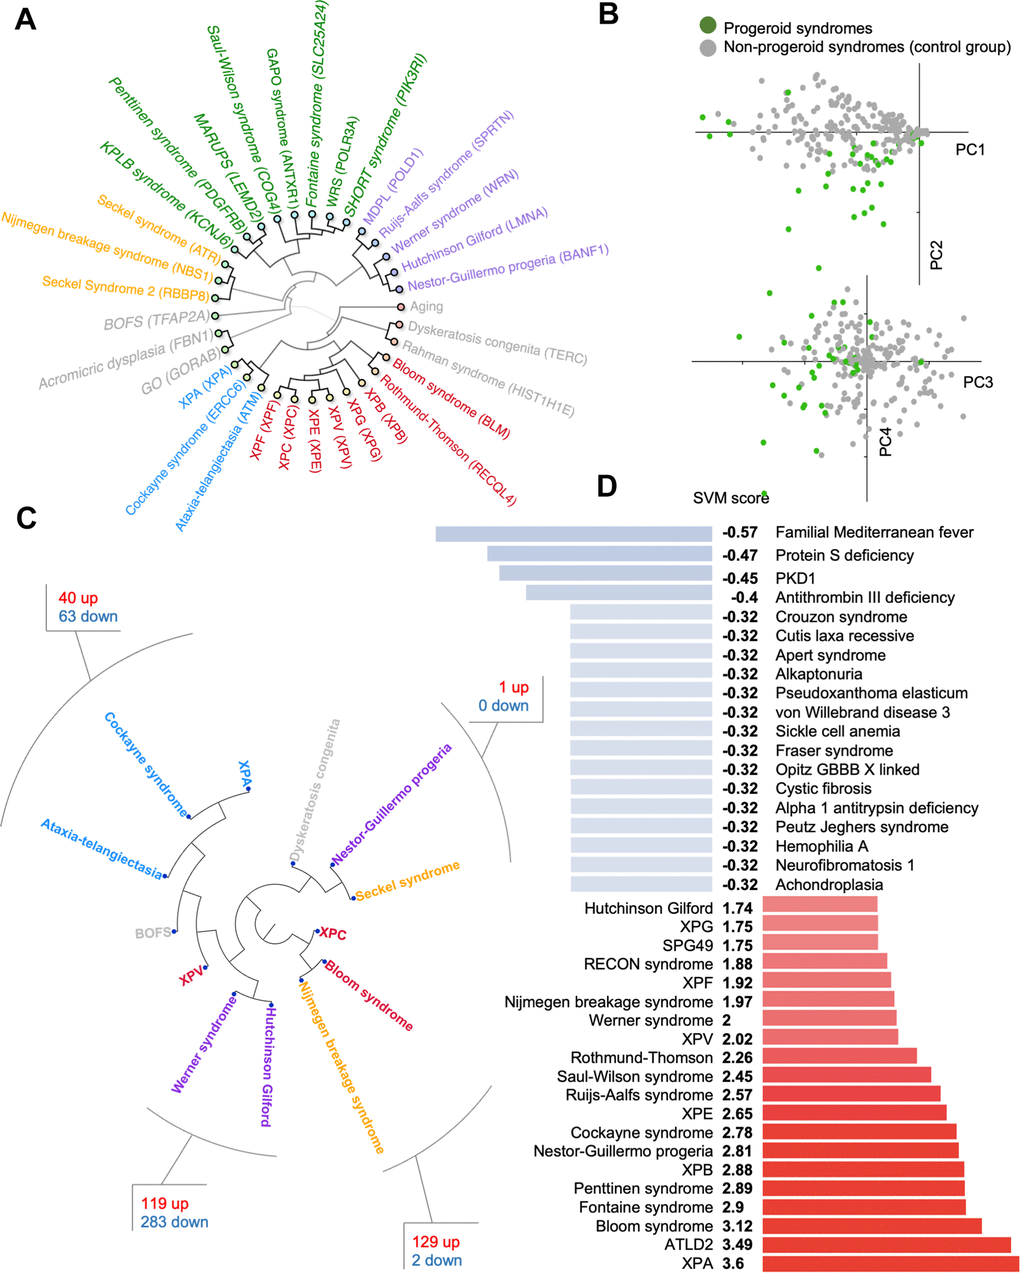
Figure 2.Progeroid syndrome overview. (A) Agglomerative hierarchical cluster based on phenotype prevalences using uncentered similarity and average linkage. (dark green are new to the database, other colors represent different clusters). Each syndrome group is color coded in the inner circle. (B) Principal component analysis of diseases based on the prevalence of phenotypes. (C) Hierarchical clustering of publicly available dataset for some premature aging diseases and the shared pathways between closely associated diseases. (D) Support vector machine scores for premature aging diseases (available at https://www.mitodb.com).