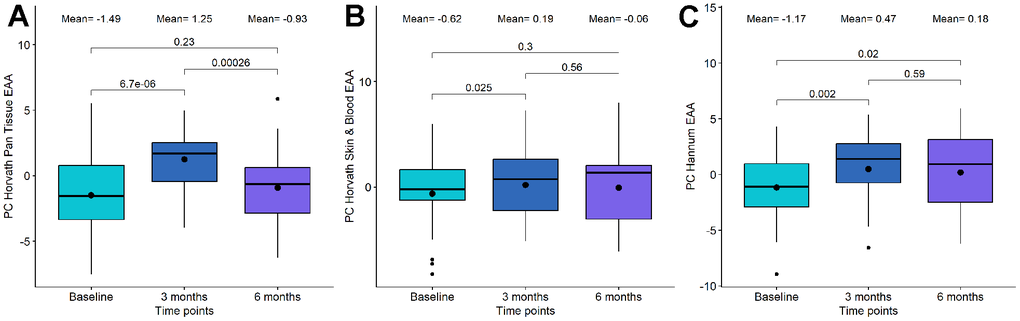
Figure 2.Boxplot showing the evolution of epigenetic age acceleration (EAA) first-generation clocks in the Dasatinib and Quercetin (DQ) study. (A) PC Horvath pan tissue EAA. (B) PC Horvath Skin and Blood EAA. (C) PC Hannum EAA. In the X-axis, the time points of measurements, in the Y axis, the EAA measure. On the top, the mean values at each time point and the p-values of the paired t-tests. The box represents the interquartile range (IQR) with the median represented as a horizontal line and the mean as the dot. The vertical lines show the minimum and maximum values. When outliers are identified, those values are represented as dots.