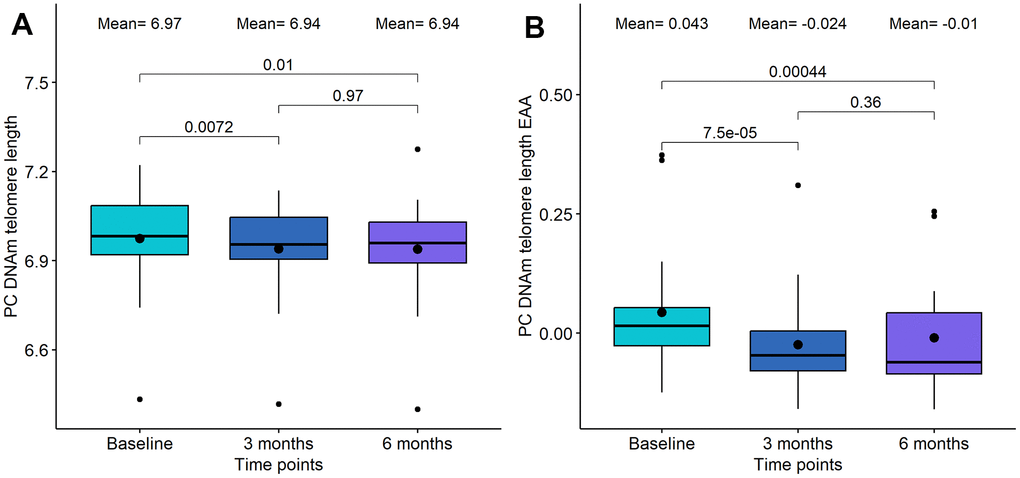
Figure 3.Boxplot showing the evolution of DNA methylation (DNAm) based telomere length in the DQ study. (A) DNAm telomere length. (B) DNAm telomere length acceleration. In the X-axis, the time points of measurements, in the Y axis, the epigenetic metric. On the top, the mean values at each time point and the p-values of the paired t-tests. The box represents the interquartile range (IQR) with the median represented as a horizontal line and the mean as the dot. The vertical lines show the minimum and maximum values. When outliers are identified, those values are represented as dots.