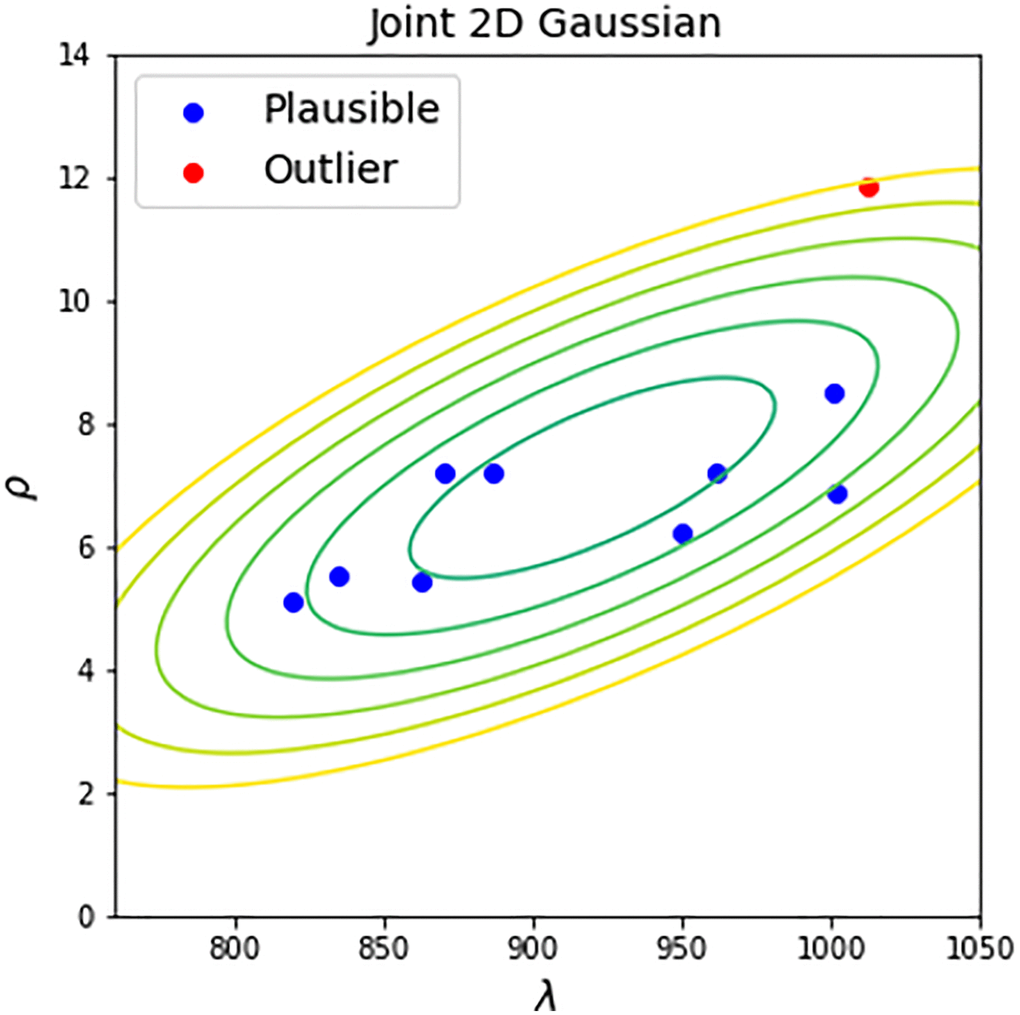
Figure 4.Inter-study plausibility test. 2D Gaussian contour plot represents the reference distribution of parameters of high-quality control datasets. The new datasets undergo plausibility Hotelling’s T-squared test with the level of significance equal to 0.01. If a dataset has a Hotelling’s p-value larger than 0.01, it is recognized as plausible (blue points). Otherwise, the dataset is recognized as outlier (red points).