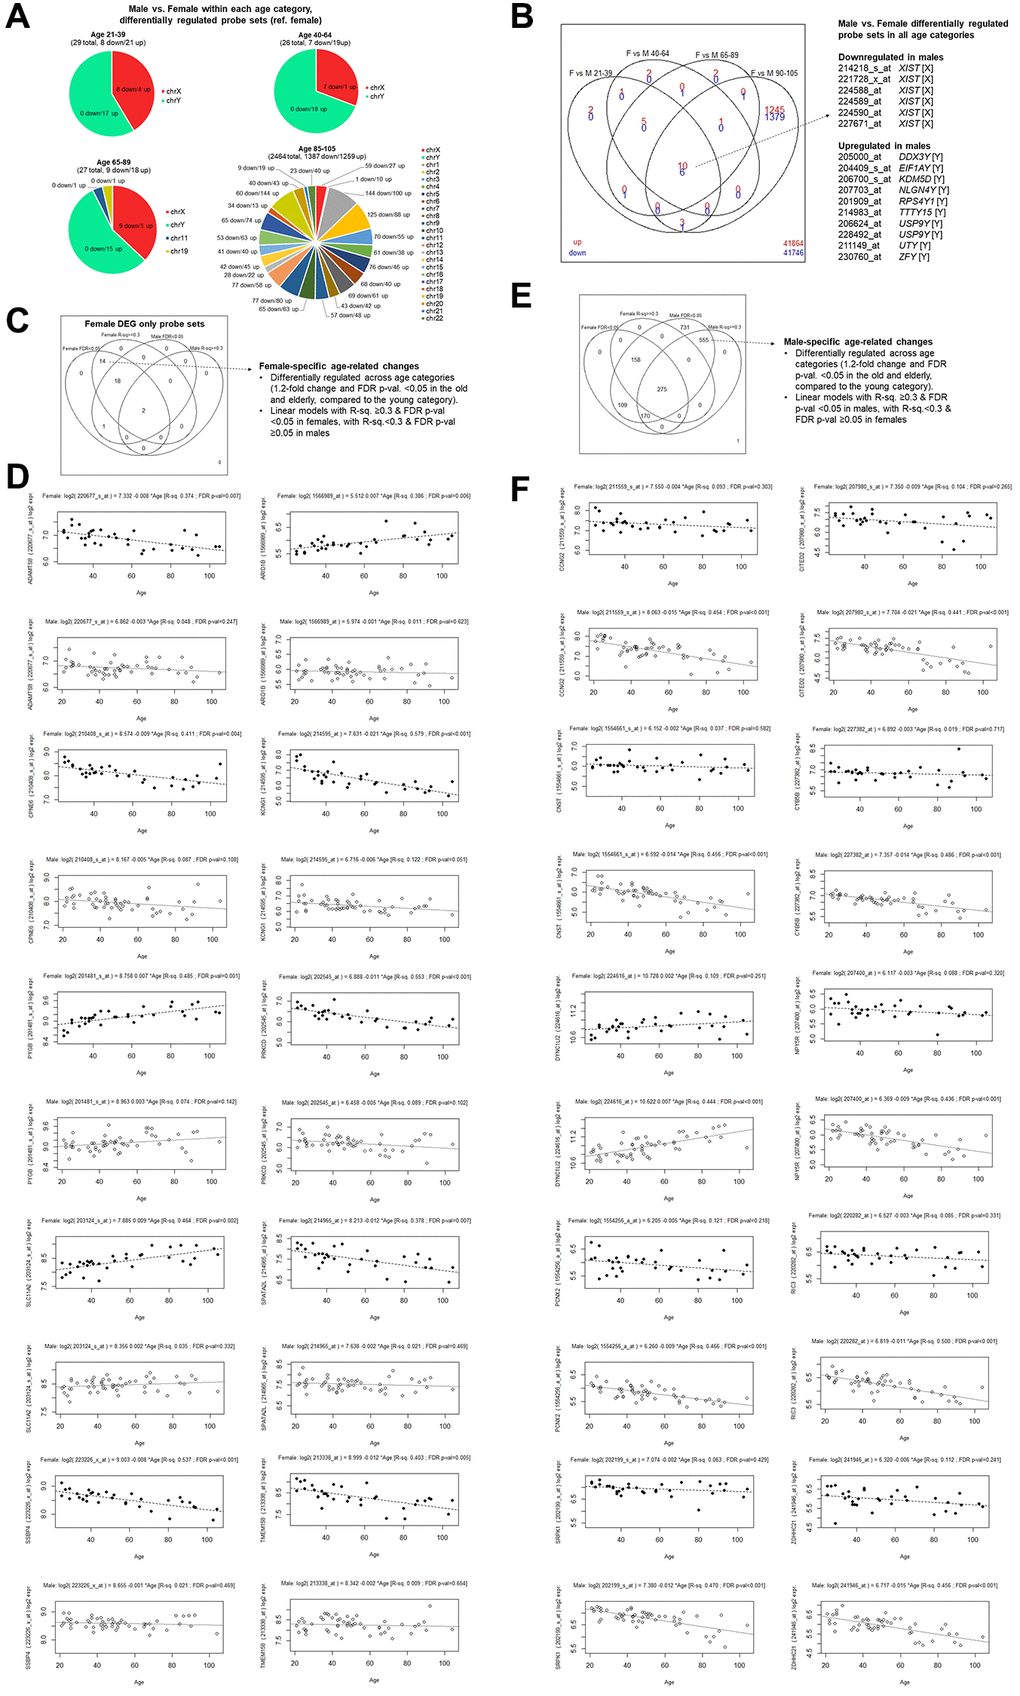
Figure 2.Female versus male gene expression analyses within age categories. (A) Chromosomal locations of probe sets found to have at least 1.2-fold difference and with FDR-adjusted p-value < 0.05 comparing females and males within each age category. (B) Overlaps of transcripts found to be differentially expressed in females and males (reference: females) in different age categories. The 16 probe sets found in all age categories are listed, with their probe set annotation, gene name, and chromosomal location indicated in square brackets. (C) Female-specific age-related transcripts by the stringent criteria. Transcripts that were found to be differentially regulated in the old and elderly categories compared to the young (at least 1.2-fold difference and FDR p-value < 0.05) only in females (35 probe sets) were assessed whether they were also associated with age in a univariate linear regression model (R2 value ≥0.3 and coefficient estimate t-test p-value < 0.05) only in females. (D) Linear regression models were plotted by sex, where the top panels with black circles correspond to females and the bottom panels with open circles correspond to males. Top ten representative probe sets with high R2 and FDR p-value < 0.05 only among females, while having higher FDR p-value among males, were plotted. (E) Male-specific age-related transcripts by the stringent criteria. Transcripts that were found to be differentially regulated in the old and elderly categories compared to the young (at least 1.2-fold difference and FDR p-value < 0.05) only in males (1999 probe sets) were assessed whether they were also associated with age in a univariate linear regression model (R2 value ≥0.3 and coefficient estimate p-value < 0.05) only in males. (F) Linear regression models were plotted by sex, where the top panels with black circles correspond to females and the bottom panels with open circles correspond to males. Top ten representative probe sets with high R2 and FDR p-value < 0.05 only among males, while having higher FDR p-value among females, were plotted.