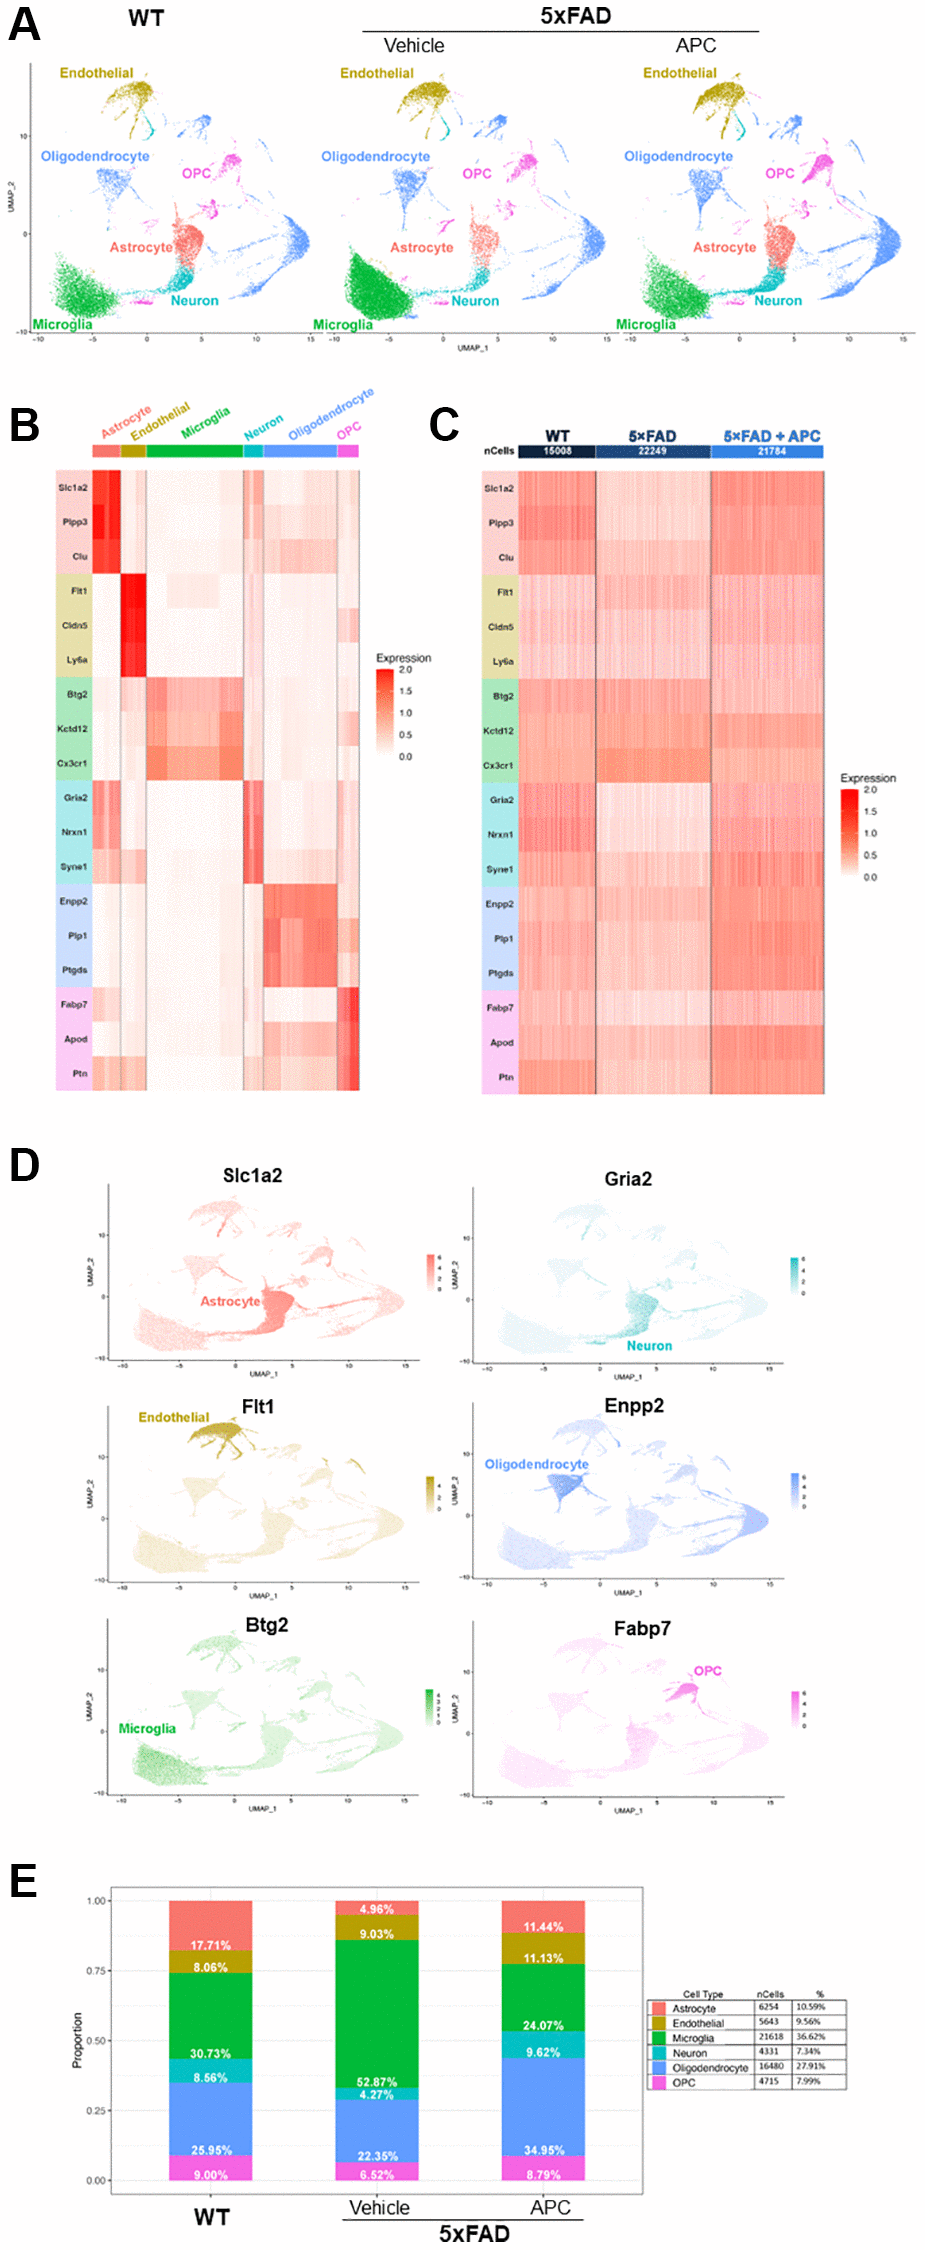
Figure 1.(A) Uniform Manifold Approximation and Projection (UMAP) dimensional plot of the primary integrated dataset split by sample; list of unsupervised clusters colored by cell-type annotated. Wildtype (left), 5xFAD (center), 5xFAD + APC (right). (B) Heatmap of top two conserved marker gene expression in each cluster used for cell-type annotation. Gene color corresponds to cell-type annotation. (C) Heatmap of top two conserved marker gene expression in each dataset used for cell-type annotation. Gene color corresponds to cell-type annotation. Number of cells shown per sample. (D) Feature plot of top marker genes, coloring cells by expression of the top marker gene for each cell-type annotated. (E) Proportion and percentage of each cell-type observed in each individual sample as well as the overall integrated dataset.