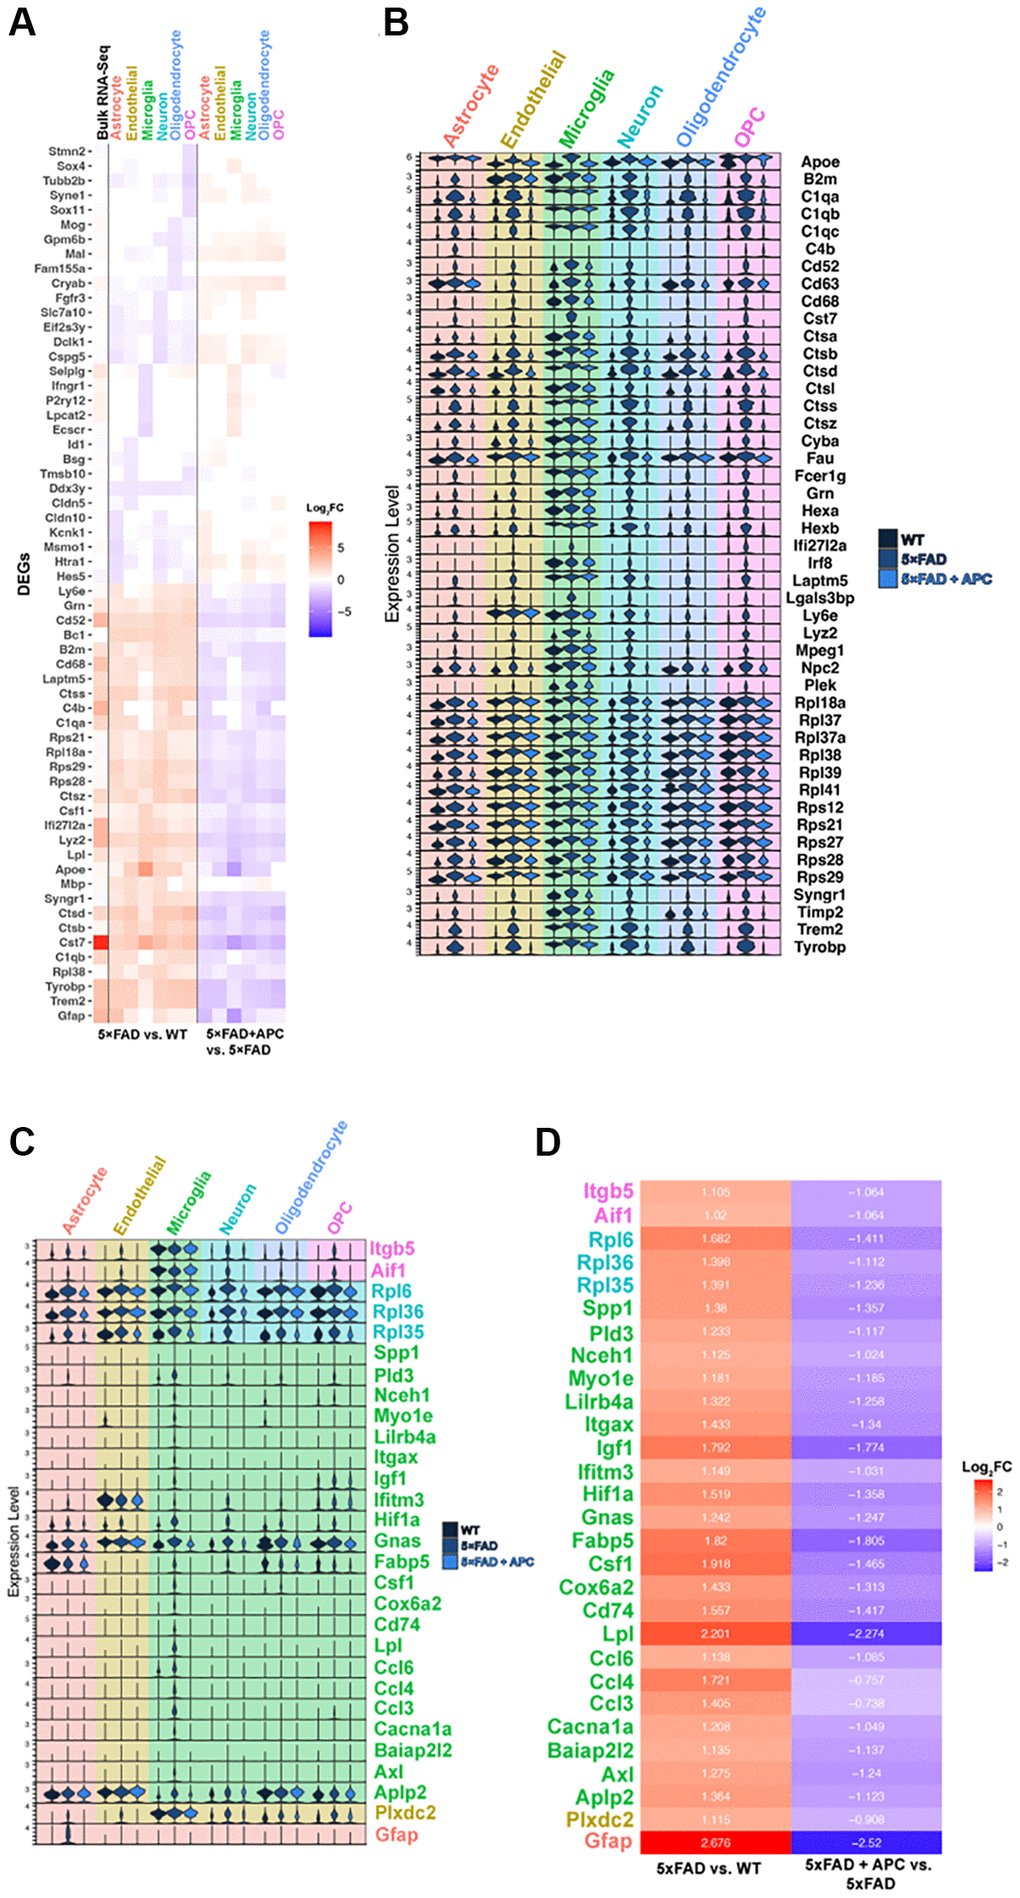
Figure 2.(A) Top 5 most significant DEGs (p-value = 0) per cell type in 5xFAD versus WT (left) and corresponding expression with APC-treatment (right). Bulk RNA-seq shown in column furthest left (6-month 5xFAD vs. WT). (B) Stacked violin plot of the top global DEGs (p-value < 0.05) found in multiple cell-types. (C) Stacked violin plot of unique DEGS highly differentiated within a particular cell-type. (D) Corresponding heatmap of unique DEGs highly differentiated in a particular cell-type (Figure 2C) plotted with Log2FC value in that cell-type. 5xFAD versus WT (left), 5xFAD + APC versus 5xFAD (right).