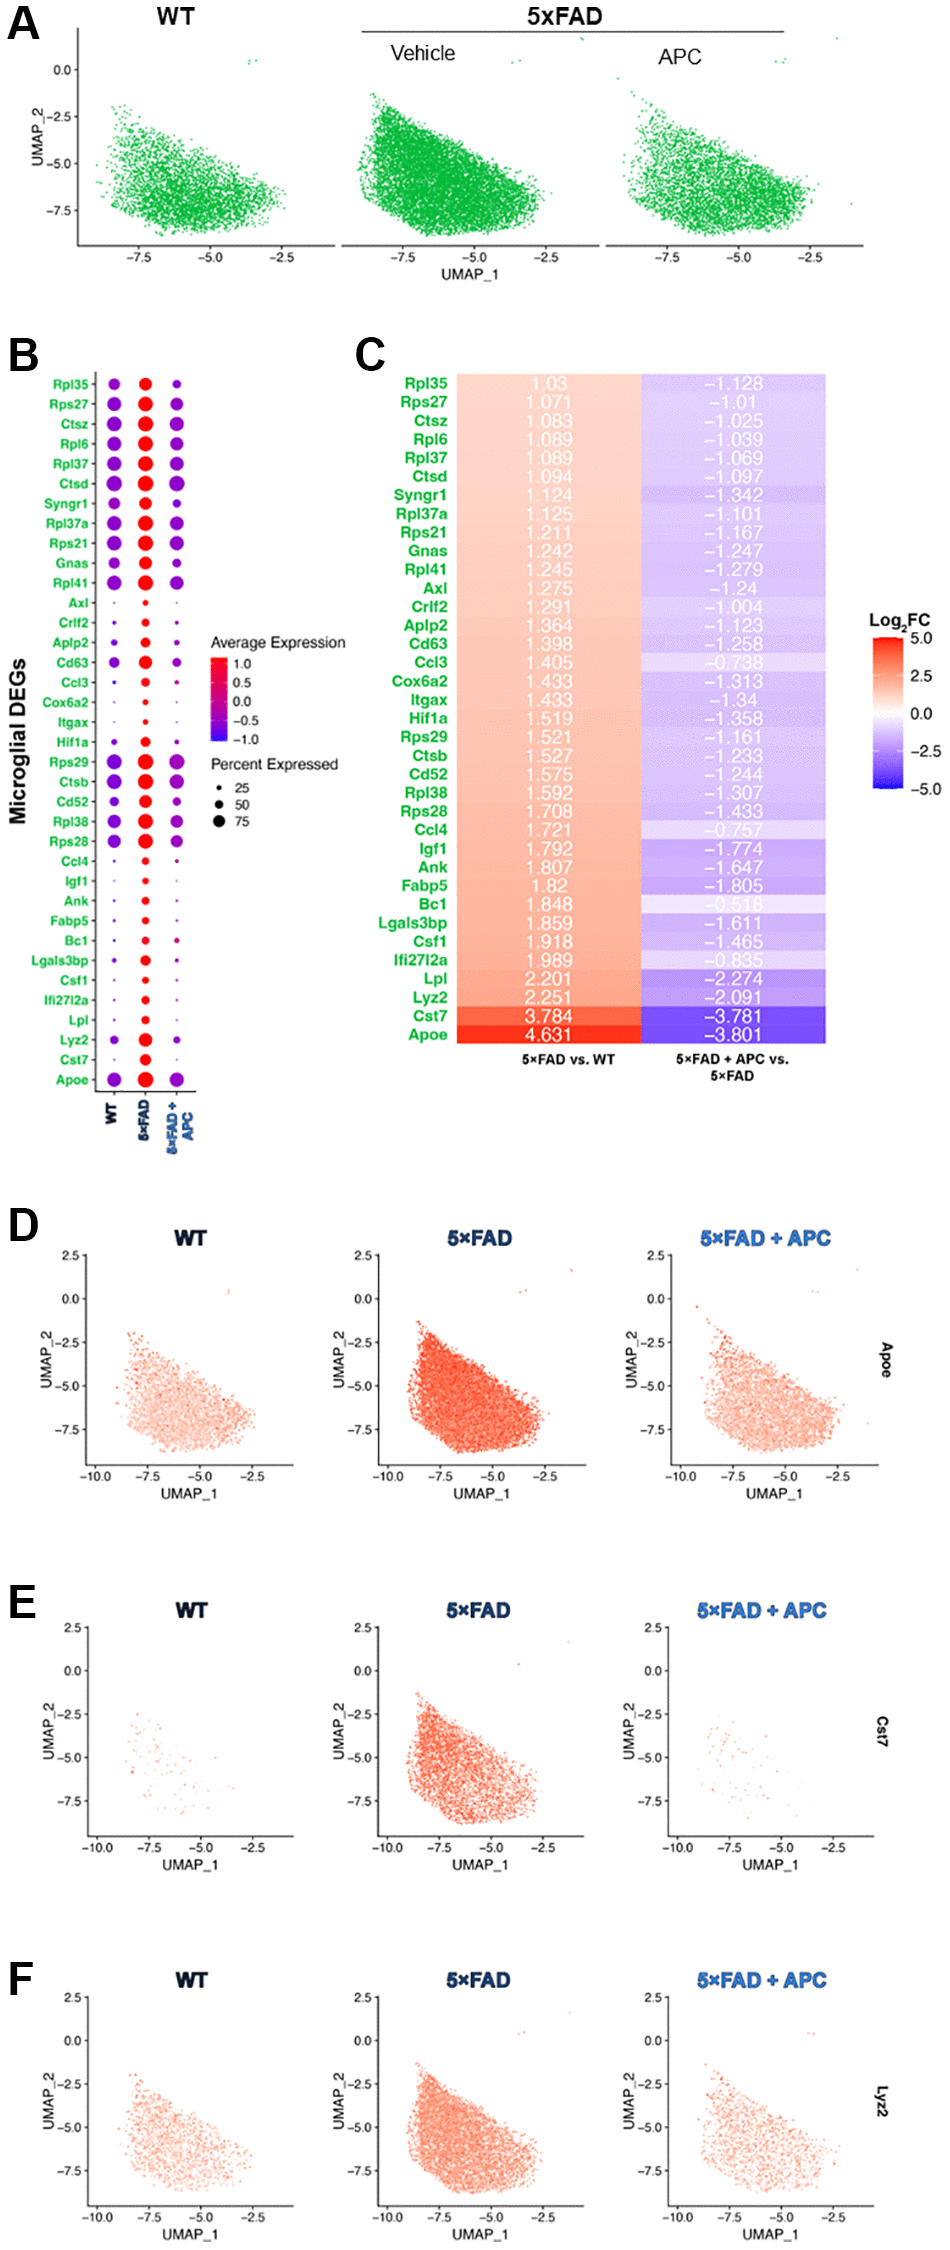
Figure 3.(A) UMAP dimensional plot of the microglial cell subset from the primary integrated dataset (Figure 1A) split by original sample, WT (left), 5xFAD (middle), 5xFAD + APC (right). (B) Dot plot of the top DEGs impacted by APC-treatment (Log2FC > 1, p-value = 0) in the microglial subset. (C) Corresponding heatmap of the top DEGs most impacted by APC-treatment in the microglial subset. Plotted with Log2FC value, 5xFAD versus WT (left), 5xFAD + APC versus 5xFAD (right). (D–F) Split feature plot of the top 3 microglial DEGs: Apoe, Cst7, and Lyz2 expression in each sample respectively.