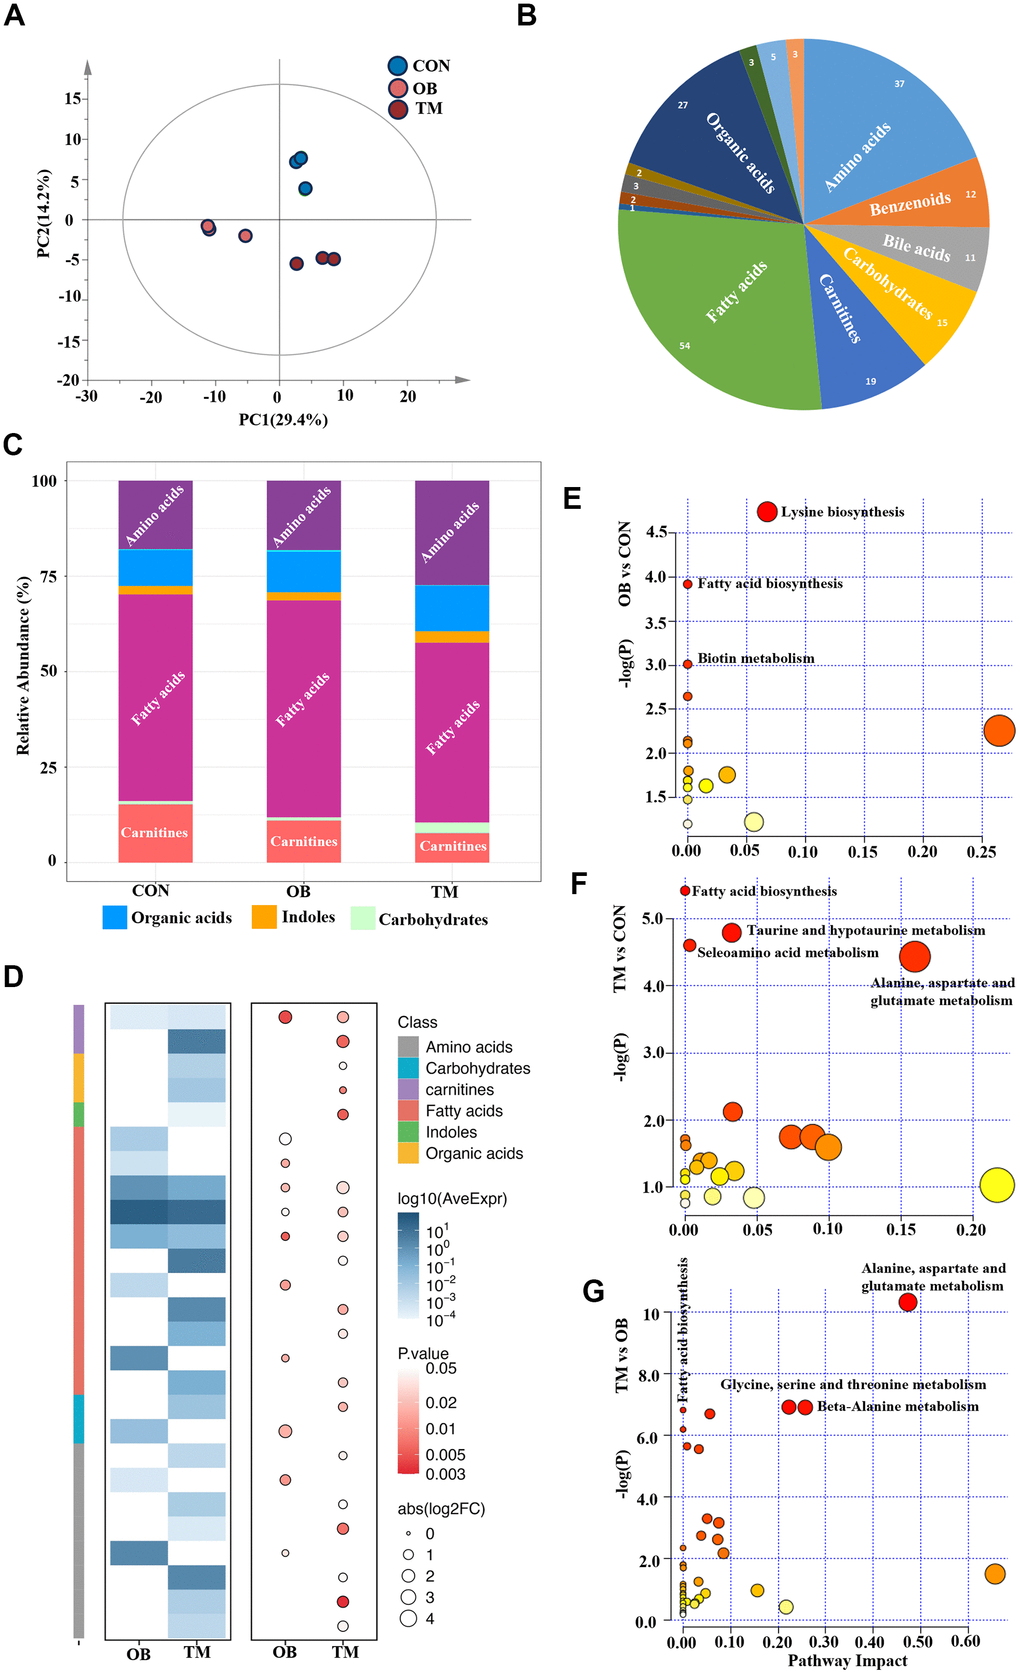
Figure 3.Metabolic profiling reveals distinct metabolite patterns in the CON, OB, and TM groups. (A) PCA plot elucidates the separation of metabolomic profiles among the CON, OB, and TM groups, indicating significant differences. (B) Categorization of detected metabolites from the comprehensive metabolomics study, showcasing the diversity of metabolites analyzed. (C) Comparative analysis of metabolite clusters' relative abundance in the CON, OB, and TM groups, highlighting variations in metabolite distribution. (D) Heatmap illustrating the differential metabolite profiles across the CON, OB, and TM groups. The color intensity represents the logarithm of average expression levels (log10(AveExpr)) for different compounds across two conditions (OB and TM) compared with CON. The size of the circles corresponds to the absolute value of the logarithm of the fold change (abs(log2FC)), and the color of the circles represents the p-value, indicating the statistical significance of the differences observed. The compounds are categorized by class, as indicated by the color key on the right side of the image. (E–G) Pairwise plots of Metabolic Pathways Enrichment Analysis (MPEA) for the CON, OB, and TM groups, detailing the enrichment of specific metabolic pathways within each group.