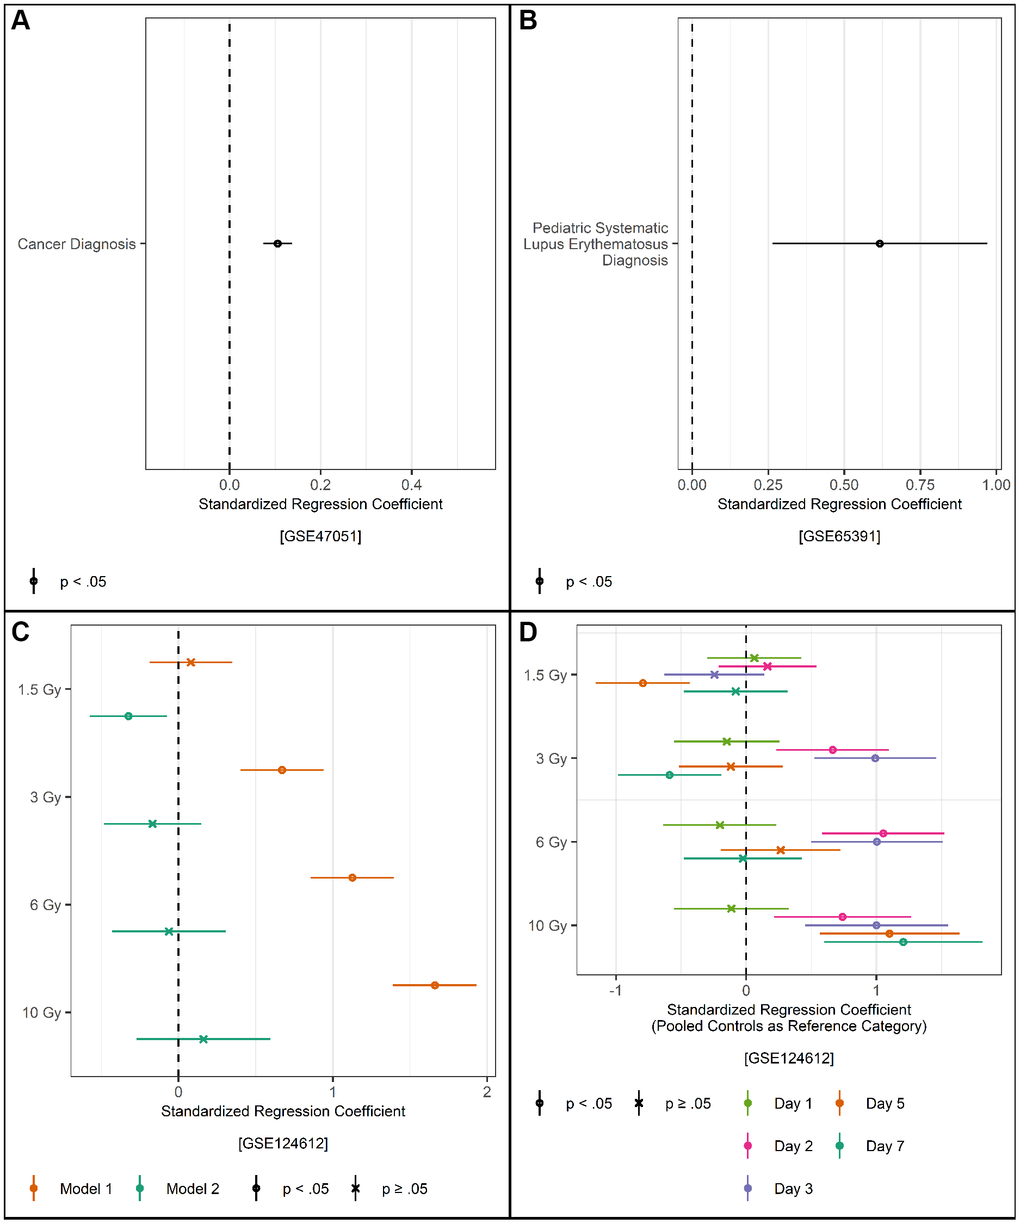
Figure 3.(A) Regression of standardized TraMA on cancer diagnosis controlling for age, sex/gender, and cell type; points represent regression coefficients and bars represent 95% confidence intervals. (B) Regression of standardized TraMA on systematic lupus erythematosus diagnosis controlling for age, sex/gender, race/ethnicity, batch, and cell type in a pediatric sample; points represent regression coefficients and bars represent 95% confidence intervals. (C) Regression of standardized TraMA on irradiation level in a sample of Mus musculus; points represent regression coefficients and bars represent 95% confidence intervals; Model 1 controls for number of days since exposure, Model 2 controls for number days since exposure and cell type. (D) Regression of standardized TraMA on irradiation level and number of days since exposure controlling for cell type in a sample of Mus musculus.