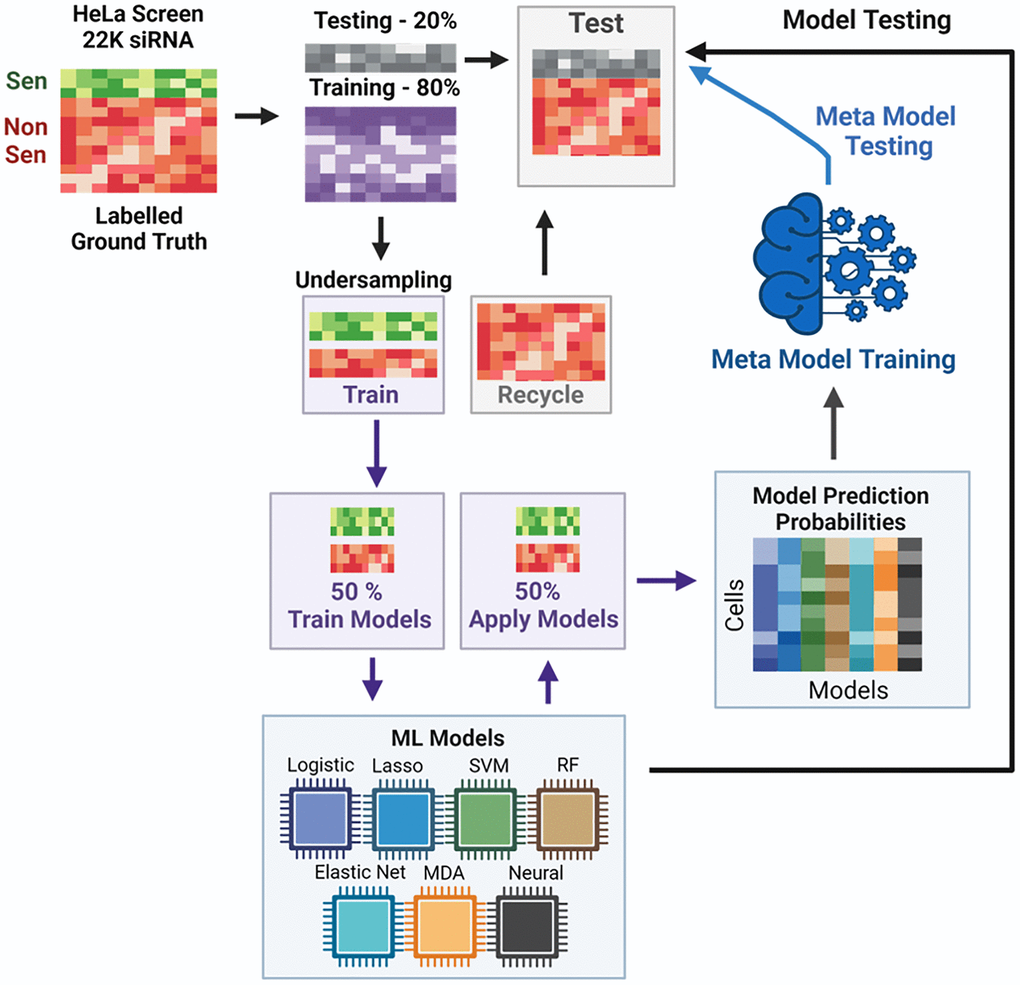
Figure 2.Overview of SAMP-Score model development. Each model was assessed according to a range of criteria, which are visualised in the model metrics (Figure 3A) and confusion matrix heatmaps (Figure 3B), as well as neural network map (Figure 3D) and ROC curves (Figure 3E; Supplementary Figure 4). The model metrics are nuanced and can be misleading when viewed in isolation. For instance, accuracy is a measure of correct predictions and is often relied upon as a single readout of model performance. But in a hypothetical example where there are 99 majority cases (e.g., NonSen) and 1 minority case (e.g., Sen) then a model may be 99% accurate by simply always predicting NonSen; but this would not be a useful tool. Therefore, particularly in senescence research where instances are likely to be imbalanced, particular care in assessing model performance must be taken.
Figure 2 — SAMP-Score: a morphology-based machine learning classification method for screening pro-senescence compounds in p16 positive cancer cells | Aging