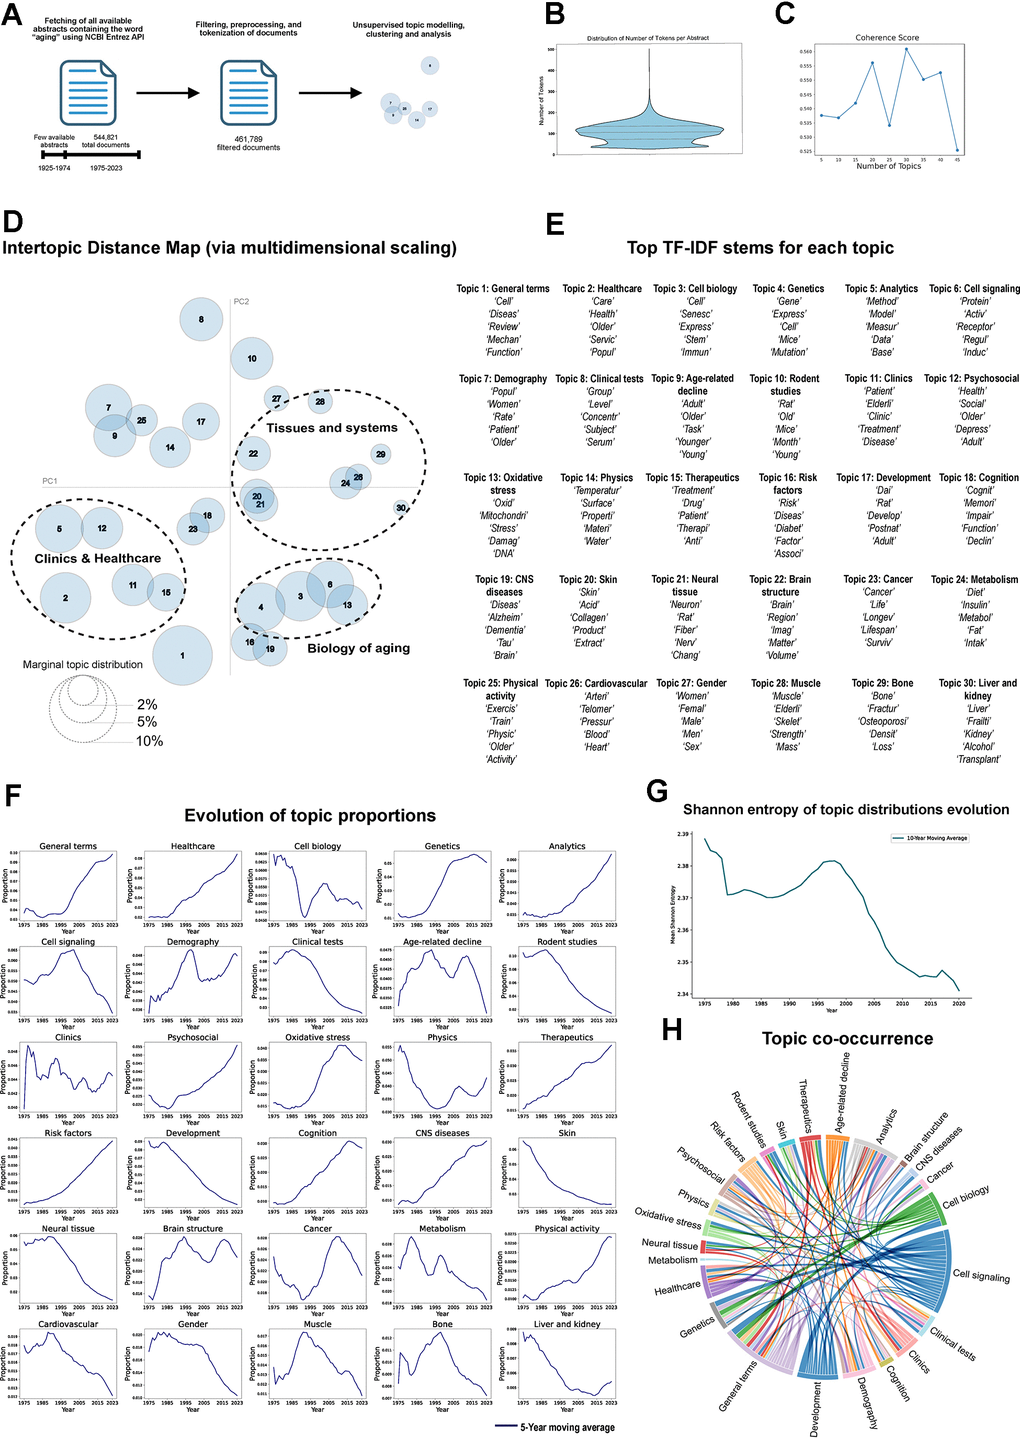
Figure 1.Topic modeling of aging related abstracts. (A) Workflow. (B) Distribution of number of words per abstract. (C) Coherence score of different number of topics using LDA topic modeling. (D) Intertopic Distance Map (PCA) of topics identified through LDA, distance between bubbles corresponds to the similarity between topics and the size represents the proportion of each topic within the corpus. (E) Top differential stems of each topic based on TF-IDF scoring. (F) Evolution of topic distributions along the whole corpus, each line represents the 5-year moving average of each topic proportions (1975-2023). (G) Shannon entropy evolution of topics distribution (1980-2023). (H) Chord diagram illustrating the co-occurrence of topics in the document corpus. The width of each chord is proportional to the co-occurrence magnitude.