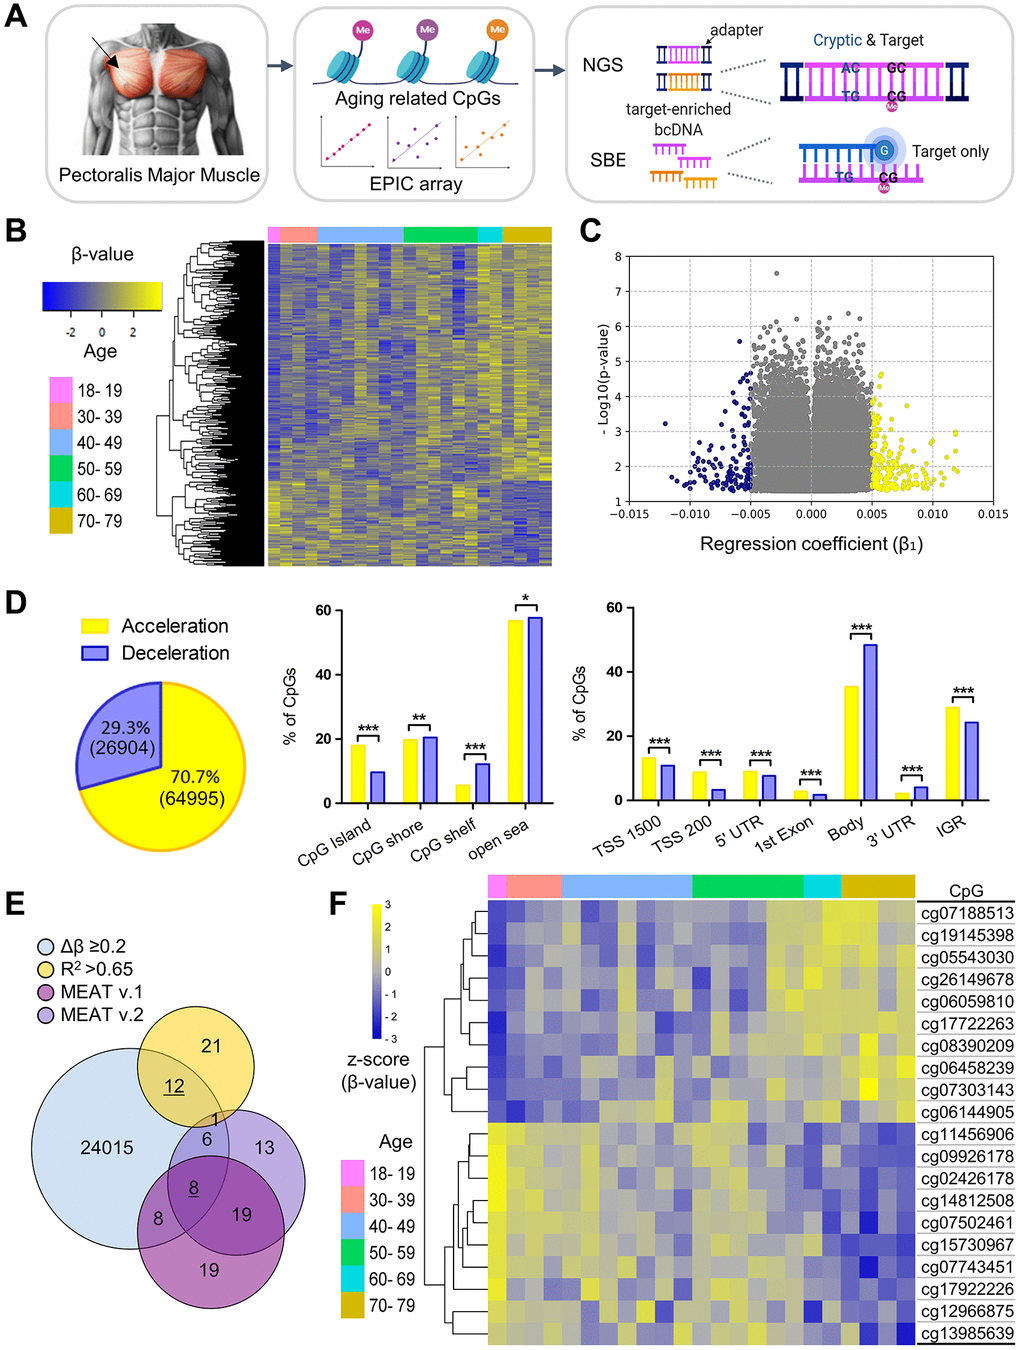
Figure 1.Identification and characterization of aging-related skeletal muscle-specific CpGs. (A) Schematic overview of experimental workflow. The diagram, created using BioRender, illustrates the workflow starting with the collection of PM muscle tissue, indicated an arrow pointing to the anatomical site clearly demarcated through shaded surrounding areas. DNA was bisulfite-converted and analyzed using the Infinium Methylation EPIC array to identify age-associated CpGs. Cryptic and target CpGs were examined via NGS, while only target CpGs were used for SBE. (B) Two-way hierarchical clustering heatmap of methylation profiles from 23 male PM muscle samples profiled by the EPIC array. Samples are color-coded by age group. The heatmap displays 500 randomly selected CpGs from 91,899 significant age-related CpGs (p < 0.05), with beta values normalized to Z-scores (yellow for higher, blue for lower values). (C) Volcano plot showing regression coefficients (β1) from age-related linear regression. Each dot represents a CpG with p < 0.05. Yellow and blue dots indicate CpGs with methylation gain and loss with age, respectively. (D) Enrichment of significant CpGs by genomic context. The Venn diagram shows the distribution of methylation accelerated (yellow) and decelerated (blue) CpGs among 91,899 significant CpGs. Bar plots display CpG distributions relative to CpG islands (left bar graph) and chromatin regions (right bar graph) using raw counts (the number of CpG sites) and the Chi-square (χ2) test. Statistical significance is denoted as *p < 0.05, **p < 0.01 and **p < 0.001. (E) Filtering of CpGs through multi-step criteria. The Venn diagram displays the overlap of CpGs filtered by effect size (Δβ ≥ 0.2), model fit (R2 > 0.65), and prior muscle-specific clocks (MEAT v.1 and v.2). Twelve and eight final CpGs (underlined) were selected for NGS- and SBE-based modeling. (F) Heatmap of the final 20 CpGs selected for age prediction, grouped by age. Beta values are Z-score normalized; age groups are color-coded.