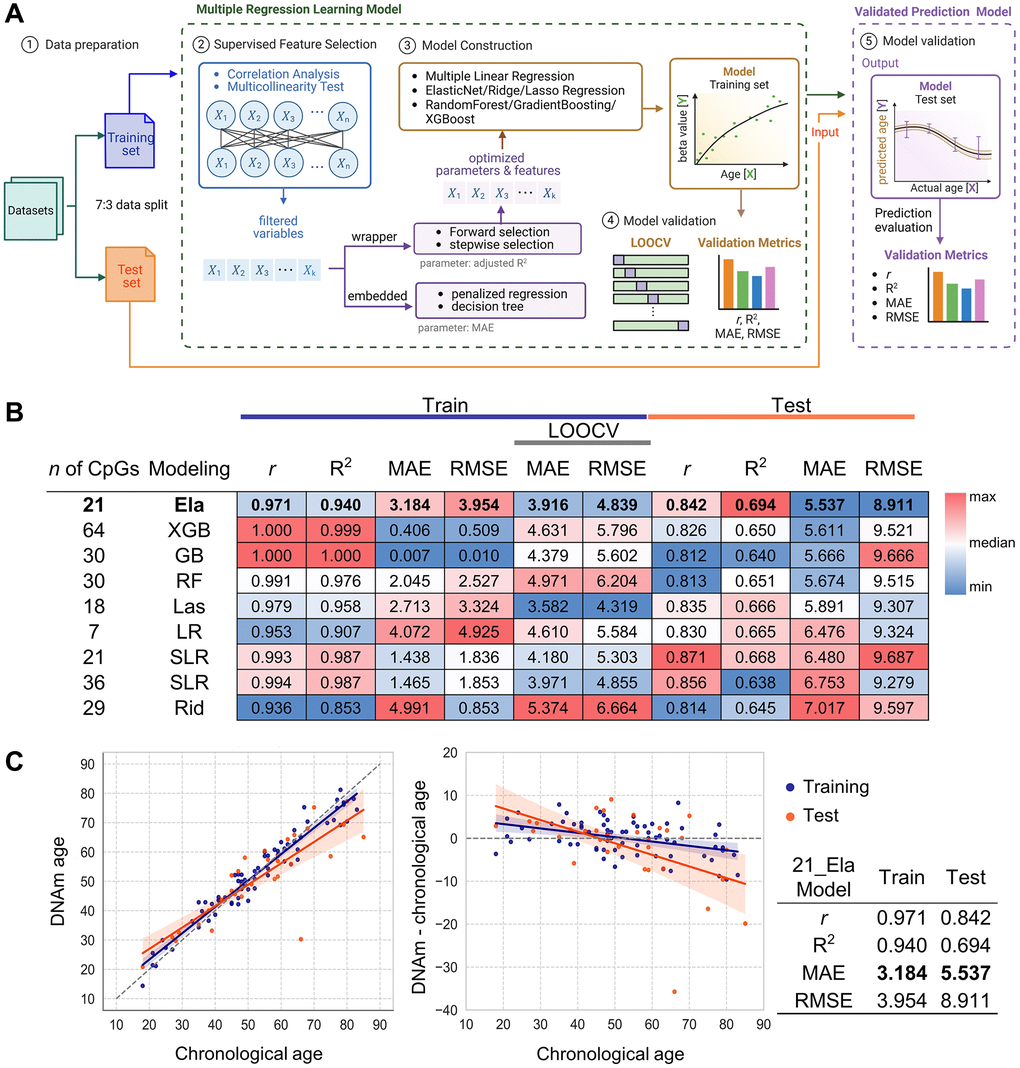
Figure 3.Development and validation of age prediction models using the NGS system. (A) Schematic of the data processing workflow for NGS and SBE-based models, created using BioRender. Data were divided into training and test sets at a 7:3 ratio. Supervised feature selection involved correlation analysis and multicollinearity filtering, followed by model construction using forward selection, stepwise selection, penalized regression, and decision tree models with optimized parameters. Model validation was performed through LOOCV, with performance evaluated by Pearson’s r, R2, MAE, and RMSE. Finally, the validated prediction model was applied to test sets. (B) Performance heatmap of nine machine learning models developed from NGS data. Models differ by algorithm (LR, SLR, Ela, Las, Rid, RF, GB, XGB) and CpG set. Metrics (r, R2, MAE, RMSE) were calculated for both training and test sets (n = 103). LOOCV was used for training validation. Heatmap color scale reflects relative performance for each column criterion and the top NGS model is indicated in bold. (C) Prediction accuracy of the best-performing NGS model. The best model’s accuracy was evaluated by comparing predicted age with chronological age for 103 samples in both the training (orange) and test (blue) sets (left plot). Residuals between DNA methylation (DNAm) age and chronological age are plotted (right plot). Regression lines are shown with each color, with 95% confidence intervals shaded. Model performance metrics are summarized in the accompanying table. Abbreviations: LOOCV: Leave one out cross validation; LR: Linear regression; SLR: Stepwise Linear Regression; Ela: ElasticNet; Las: Lasso regression; Rid: Ridge regression; XGB: XGBoost; RF: RandomForest; GB: GradientBoosting.