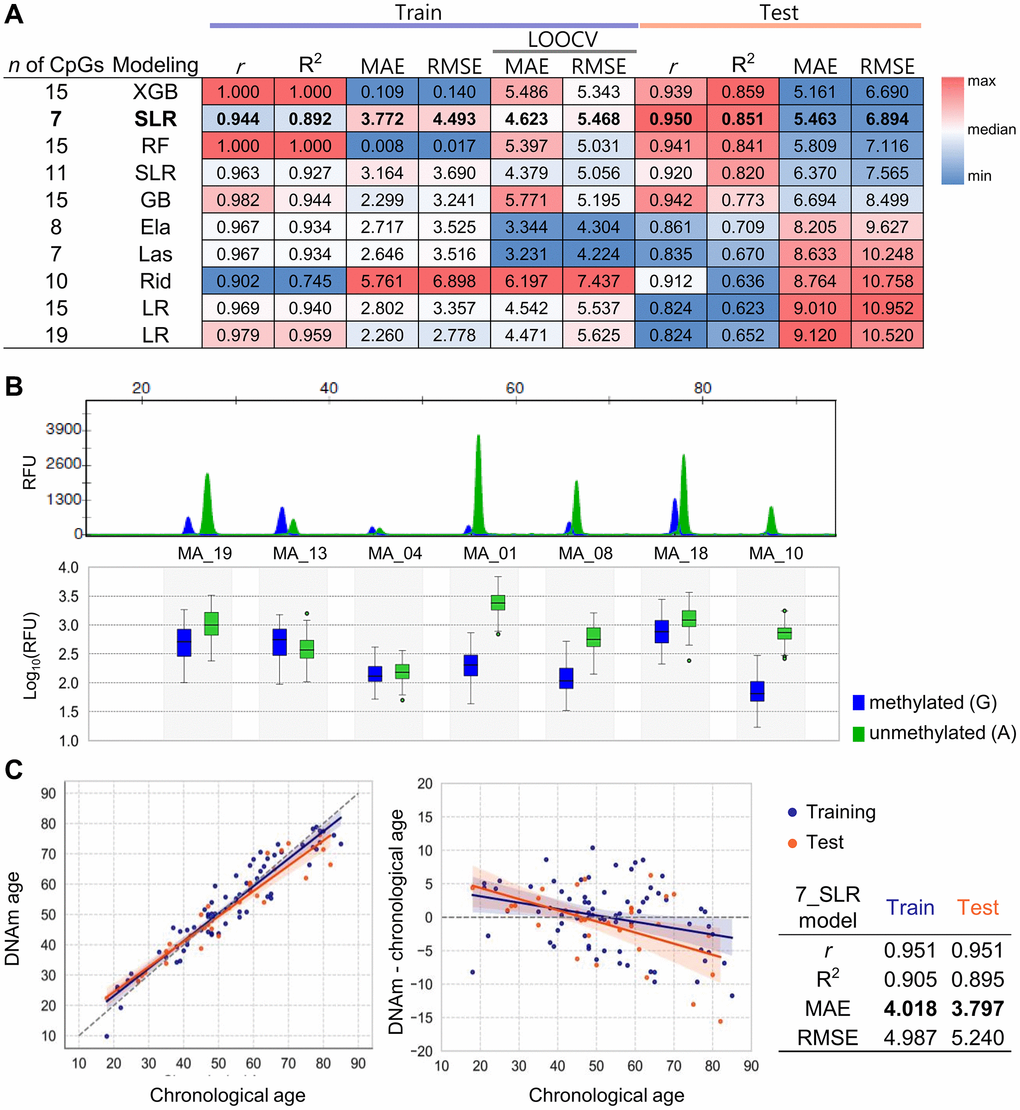
Figure 4.Development and validation of age prediction models using the SBE system. (A) Performance heatmap of 10 machine learning models based on the SBE platform. Models differ by algorithm (LR, SLR, Ela, Las, Rid, RF, GB, XGB) and number of CpGs used. The performance metrics such as r, R2, MAE, and RMSE values were calculated for both training and test sets. A total of 68 samples were used, with 43 assigned to the training set and 25 to the test set. An additional 35 samples were later included, resulting in a final dataset of 103 samples, consisting of 71 samples for training and 32 for testing, which were used for the final modeling. The heatmap displays relative values using a red-to-blue gradient for each column criterion. The top-performing SBE model is shown in bold. (B) Electropherogram of a unified SBE system using seven CpGs selected from both NGS and SBE models. Capillary electrophoresis was performed using a 3500 genetic analyzer (upper plot). The log10(RFU) values for each peak are shown in a box plot, displaying the mean ± SEM (lower plot). Blue fluorescence represents Guanine (G), representing methylated cytosine, while green fluorescence indicates Adenine (A), representing unmethylated cytosine. (C) Age prediction performance of the best-performing SBE model. The best model’s accuracy was assessed by comparing predicted age with chronological age for 103 individuals in the training and test sets, represented by orange and blue points, respectively (left plot). Residuals between DNAm age and chronological age were plotted (right plot). Regression lines and 95% confidence intervals are shown. Performance metrics for the model are summarized in the accompanying table.