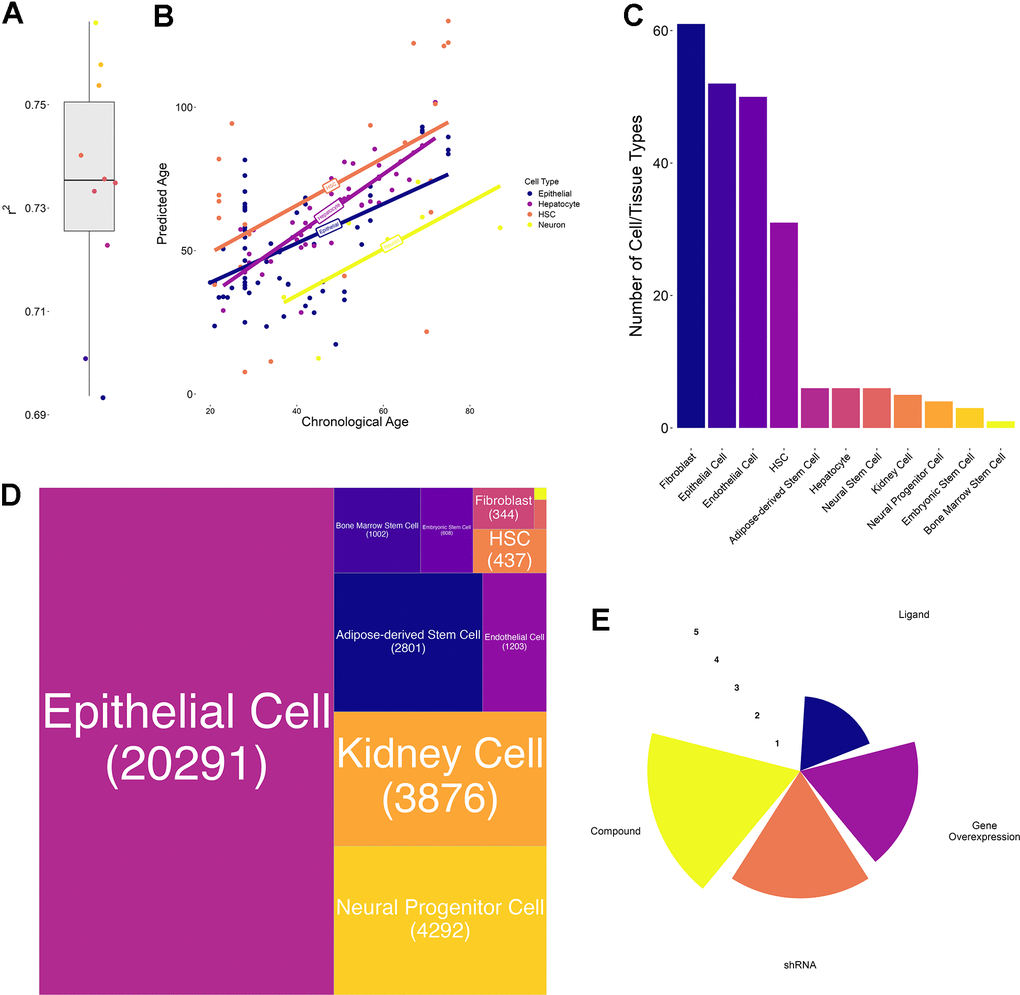
Figure 2.Transcriptional aging clock validation and characteristics of collected transcriptomic perturbation data. (A) Boxplot of the 10-fold cross-validation performed during training the transcriptional aging clock. The solid lines represent the median and whiskers extend to +/- 1.5*IQR (interquartile range) (B) Predicted versus chronological age of independent validation samples in four different cell types: Hematopoietic stem cells (HSC, orange), hepatocytes (purple), epithelial cells (blue) and neurons (yellow). Solid lines represent the regression lines across all points of the same cell type. (C) Bar chart depicting the number of cell annotations matching each homogenized cell or tissue type. These annotations subsume different cell lines as well as orthographic representations of the same cell/tissue type. We observed the highest number of annotations for Fibroblasts, Epithelial and Endothelial cells whereas bone marrow stem cells annotations were a priori unique. (D) Treemap of the number of perturbations performed in each cell or tissue type. More than 50% of the collected experiments have been performed in epithelial, followed by kidney, neural progenitor, adipose-derived stem and endothelial cells. In total, more than 80% of experiments have been performed in these 5 cell/tissue types. (E) Radar plot represents the number of experiments per perturbation type. Values are on a log10-scale.