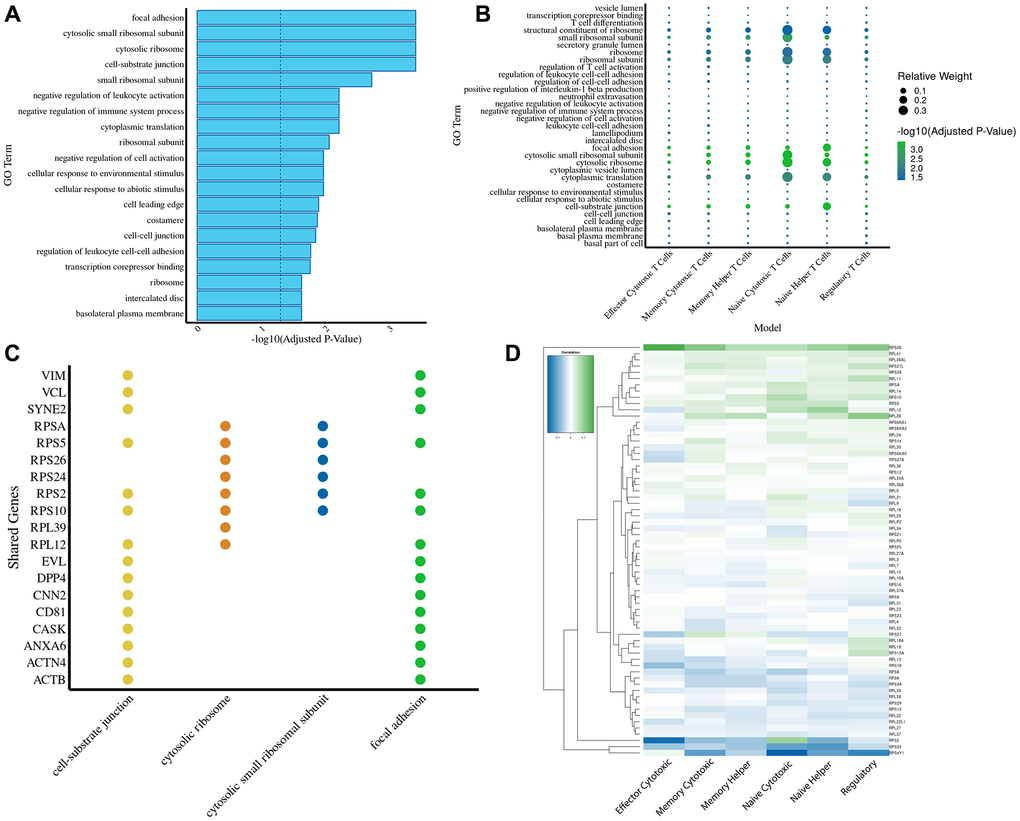
Figure 5.Gene ontology and chromosomal mapping highlight ribosomal pathways as key drivers of transcriptomic aging predictions. (A) GO term enrichment analysis of genes shared across all six T cell age prediction models reveals significant enrichment in ribosomal pathways, cell-substrate junction, focal adhesion, and cytosolic processes. The dashed line marks the significance threshold (-log10(p) = 1.3). (B) A dotplot for the GO enrichment analysis of the genes used in every model (using the relative weights of those genes in relation to the rest of the genes used in the model). (C) A bar plot displaying the top four most enriched GO terms ranked by adjusted p-value. For each GO term, the top four contributing genes were identified and compared across all enrichment terms, highlighting shared and unique functional associations among the gene sets. (D) Heatmap showing correlations of individual ribosomal gene expression with aging across T cell subsets, highlighting conserved and subset-specific trends.