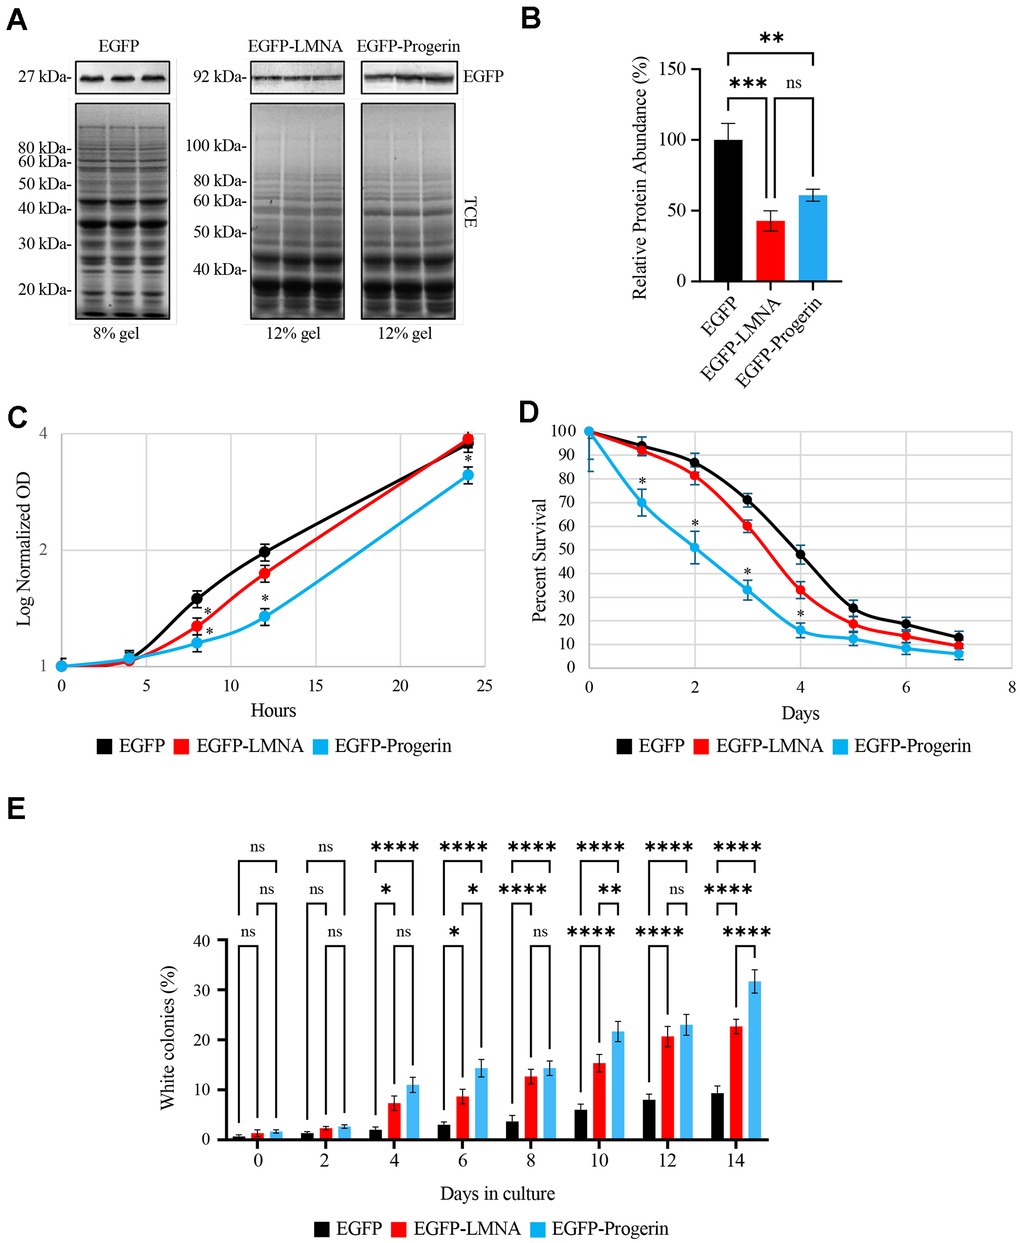
Figure 1.Ectopically expressed EGFP-LMNA and EGFP-Progerin are targeted to the nuclear membranes of yeast cells with EGFP-Progerin disrupting cell growth, decreasing chronological lifespan and increasing genome instability. pYES vectors containing galactose inducible promoters and encoding either EGFP, EGFP-LMNA or EGFP-Progerin were transformed into BY4741 yeast and expression induced in galactose containing media. (A) 3 colony transformants were selected from plates and grown in liquid media overnight, with proteins isolated for Western blotting for EGFP. Total protein (top panels - stained with trichloroethanol (TCE)) was used for loading controls, followed by Western blotting for EGFP (bottom panel – EGFP antibody). EGFP proteins were separated on 8% SDS-PAGE gels, while proteins for EGFP-LMNA and EGFP-Progerin are separated on 12% gels. The EGFP-LMNA and EGFP-Progerin lanes were cropped from the same gel. (B) The triplicate western bands for EGFP-LMNA and EGFP-Progerin were scanned and quantified. Values are presented as mean ± SD for n=3 and were analyzed with an ordinary one-way ANOVA with post hoc Tukey's multiple comparisons test where p-value < 0.01**, p-value < 0.001***, and p-value < 0.0001****. (C) Cultures of yeast expressing EGFP (black), EGFP-LMNA (red) or EGFP-Progerin (blue) were grown in 2% Raffinose/0.2% Galactose supplemented liquid media (n = 3) with OD600 readings collected at the times shown. Log normalized OD readings were plotted for the time points. Error bars represent standard error of the mean. * represents p-values < 0.05 via 2 tailed t-test. The OD600 at 4, 8, 12 and 24 hours were plotted for growth curves conducted in 2% RAF/0.2% GAL, as shown in Supplementary Figure 1. (D) Chronological lifespan assays were conducted using methylene blue on yeast expressing EGFP (black), EGFP-LMNA (red) and EGFP-Progerin (blue) and the percent cell survival over 7 days plotted. n=3. * represents 2-tailed t-test p-value < 0.05. Comparable CLS experiments performed using the standard colony counting method are shown in Supplementary Figure 2 (n=3). (E) Colony reversion assays were performed by expressing EGFP, EGFP-LMNA or EGFP-Progerin into the YPH500 strain carrying a point mutation in the ADE2 gene. Westerns confirming correct expression of the proteins is shown in Supplementary Figure 3. This leads to yeast producing red coloration on YPD media. Red and white colonies were counted and the percentage of white colonies from EGFP (black), EGFP-LMNA (red) and EGFP-Progerin (blue) yeast was determined. The percentage of white colonies (y-axis) were scored over each day (x-axis) of the assay. Error bars - standard error of the mean (n=3). * represents p-value < 0.05, and ** via 2 tailed t-test.